Does calorie and unit information influence our drinking behaviour?

By Olivia Maynard

Over the past two years we’ve invited hundreds of people into the lab to drink beer. Unfortunately, we weren’t there to socialise; this was in the name of science. We wanted to know whether giving people information about the number of units and or calories in their beer influenced how much they drank and their perceptions of drinking.

There are strong arguments for including this information: providing unit information may increase knowledge about alcohol consumption and calorie information may help drinkers choose lower calorie (and as a result lower unit) beverages. However, we also wondered whether there might be some unintended consequences of providing this information, particularly for those who are highly motivated to drink. What if unit information simply allows these drinkers to choose higher strength drinks and calorie information only discourages them from eating more, not drinking less? What if discussion around mandatory unit and calorie labelling is distracting us from the bigger issues: health warnings, minimum unit pricing, improving treatment for alcohol dependence and stopping alcohol advertising to young people, to name a few?

So, with this healthy level of scepticism, we set about inviting 264 regular alcohol consumers (mostly undergraduate students) to attend a lab session where they were given some beer and completed some taste ratings. What participants didn’t know was that they had been randomly assigned to one of four conditions. One group had information about the calorie and unit content of the beers, one group just got calorie information, another had just unit information, and the final group got no information at all. As well as measuring how much beer they drank, we also asked participants to reflect on the likely impact of unit and calorie information on their drinking behaviour.

You can read all the results in our (open access) paper that was published this week in the journal Alcohol and Alcoholism. If you want the concise version: we found no evidence that either unit or calorie information influenced how much beer people consumed and we found a lot of variation in the amount people drank.

However, it was our analysis of participants’ thoughts on unit and calorie information that proved vital to understanding what was going on here. Our participants told us that their main motivation for drinking alcohol was usually to get drunk; where unit information was perceived as being helpful, this was to help them choose the highest strength drink. Unit and calorie information was seen as distracting from the social aspect of drinking, and although some participants felt that calorie information might reduce consumption, most thought it would affect others, not themselves. Some people thought that calorie information could be misused by encouraging people to eat less (to compensate), rather than drink less.

It’s interesting that even though the unit and calorie information was very visible in our study (on a piece of paper, presented for 10 minutes), those who had received this information were still very inaccurate when it came to reporting how many units and calories were in their drinks. They basically didn’t seem to have read or engaged with it. If they’re not reading it in this context, is it likely that drinkers will read this information when it’s printed in tiny font on the back of the bottle?

So, what does this all mean for any plans to introduce unit and calorie information? Our study only really tells us about the potential impact of unit and calorie information among young adults (many of whom were students) who tend to drink to get drunk. However, our findings do call into question whether mandatory unit and calorie labelling on its own would reduce how much people drink, and also highlights potential negative unintended consequences of providing this information.

Despite some of these potential unintended consequences, there are still reasons to include unit and calorie information, if only because it’s a consumer right (you know how many calories are in just about everything else you consume). However, perhaps more effort needs to be placed on making this information more engaging and embedding it into public understanding of recommended drinking levels. Coincidentally, an analysis of the public’s awareness of new national alcohol guidelines was also published yesterday. This report argues that although the public have a relatively high awareness of what the guidelines are, they should be put into context by increasing the public’s awareness of the links between alcohol and cancer. Perhaps using health messages such as ‘Drinking alcohol regularly is linked to long-term risks such as cancer’, alongside unit and calorie information, might result in more meaningful changes in attitudes and behaviours around drinking. I feel another study coming on….

Olivia Maynard can be found on Twitter at @OliviaMaynard17

Alcohol brief interventions: how can content, provider and setting reduce alcohol consumption?

screen-shot-2016-09-23-at-10-11-24 

Alcohol brief interventions (ABIs) provide structured advice on alcohol use. They involve an assessment of individual risk with feedback and advice, brief motivational interviewing, or a combination of these techniques.

While the Government’s Alcohol Strategy (HM Government, 2012) recommends that ABIs be implemented increasingly inprimary care settings and accident and emergency (A&E) departments, the National Institute for Health and Care Excellence (NICE) calls for alcohol brief interventions to be offered by a range of practitioners and in a range of different settings.

Given national-level support for increasing and wider use of ABIs, this systematic review and multi-level meta-regression by Platt and colleagues assessed the effectiveness of ABIs on alcohol consumption and how effectiveness of ABIs differs by:

  1. Content of intervention,
  2. Provider group and
  3. Setting.
Alcohol brief interventions usually involve a combination of risk assessment, feedback, advice and brief motivational interviewing.

Alcohol brief interventions usually involve a combination of risk assessment, feedback, advice and brief motivational interviewing.

Methods

Studies were peer-reviewed randomised controlled trials (RCTs) where participants were randomly allocated to a control group (such as treatment as usual) or a group which received an alcohol brief intervention.

Brief interventions were defined as person-to-person discussions on alcohol, with between 1 and 4 sessions and a total of 2 hours intervention time. ABIs which were delivered in groups or via a computer were excluded as were those which included participants with complex health problems where it is difficult to generalise findings to the general population.

The primary outcome measure was a quantitative continuous measure of total alcohol consumption, reported as the standardised mean difference between ABI group and control group measured at follow-up. The authors also examined how ABIs influenced the frequency of alcohol consumption.

Different types of setting, provider and content were examined and these are shown (along with the number of studies in each category) in the Results section below.

A multi-level meta-analysis method was used, which allowed the authors to include a number of different effect sizes from individual studies (i.e. amount of alcohol consumed per unit of time and/or amount of alcohol consumed per drinking occasion) rather than just trying to selecting one comparable effect size for each study).

Results

Study characteristics

50 studies were included in the analyses, with 29,891 individuals contributing data. 45% of studies were conducted in the USA and 22% in the UK.

The percentage of studies which examined alcohol brief interventions with different types of content, providers and settings are shown below:

Intervention content:

  1. Motivational interviewing (MI) (48%)
  2. Enhanced motivational interviewing (MI+) (40%)
  3. Brief advice approaches (24%)

Intervention providers:

  1. Counselors (44%)
  2. General practitioners (22%)
  3. Nurses (18%)
  4. Different providers (12%)
  5. Peer-delivered (4%)

Setting of intervention delivery:

  1. Primary or ambulatory care in clinical settings such as outpatient services (38%)
  2. A&E services (20%)
  3. University (20%)
  4. Community-based delivery (12%)
  5. Hospital inpatient services (10%)

Quality of the evidence

71% of studies were classified as having a low risk of bias regarding randomisation and allocation concealment strategies. However, the method of allocation concealment was unclear in most of the studies. An intention-to-treat analysis was conducted in 47% of the studies and loss to follow-up was assessed in 80% of studies.

The overall impact of ABIs as compared with control conditions

ABIs reduced alcohol consumption by -0.15 SDs (95% confidence interval (CI) = -0.20 to -0.10) a result the authors describe as a ‘small but statistically significant effect’. However, the extent to which this is clinically meaningful is less clear.

Note: The authors present the effect sizes as SDs because they have summarised their data as standardised mean differences. This method is used when included studies all assess the same outcome, but measure it in a variety of ways. Although this makes sense statistically, it does make understanding how important these effects are clinically a little more difficult.

The authors found that this effect persisted after controlling for covariates and when conducting sensitivity analyses. The studies included in this analysis were found to have a small to medium level of heterogeneity (I2 = 37%; this figure is the percentage of variation between trials which is due to actual variation between studies as opposed to variation due to chance. A small I2 value means that the majority of the differences observed between studies was due to chance).

ABIs reduced frequency of alcohol consumed by a similar amount (-0.15 SDs, 95% CI = -0.20 to -0.11).

Content

Splitting studies by ABI content didn’t reduce the heterogeneity between studies (I2 = 39%: no, or little change in this I2 value from when all studies are considered together (I2 = 37%) indicates that this categorisation by content does not adequately explain the heterogeneity between studies).

However, it did appear that all content types were effective at reducing amount of alcohol consumed, and there was some evidence that while brief advice is more effective than MI or MI+ for amount of alcohol consumed, brief advice did not appear to reduce the frequency of consumption while MI and MI+ did.

Providers

Splitting studies by ABI provider was not found to reduce the heterogeneity between studies (I2 = 34%).

ABIs delivered by a range of different providers or by peers were not found to be effective at reducing amount consumed or frequency of consumption (although it’s important to note that very few studies were included in these categories).

There was evidence that interventions delivered by counselors, physicians and nurses were effective, with those delivered by nurses the most effective (-0.23 SDs amount consumed, 95% CI = -0.33 to -0.13).

Setting

Splitting studies by ABI setting didn’t reduce the heterogeneity between studies (I2 = 34%).

There was no evidence that ABIs delivered in hospital inpatient services and in community settings were effective in reducing either amount or frequency of alcohol consumed.

Interventions delivered in A&E, ambulatory care settings and in universities were found to reduce alcohol both amount and frequency of alcohol consumed.

This review suggests that alcohol brief interventions have a ‘small but statistically significant effect’, but it's unclear whether or not this is clinically meaningful.

This review suggests that alcohol brief interventions have a ‘small but statistically significant effect’, but it’s unclear whether or not this is clinically meaningful.

Conclusions

The authors conclude that their study provides:

important new evidence on how the effectiveness of brief alcohol interventions differs by setting, provider and content.

While this analysis does show that ABIs reduce amount of alcohol consumed and frequency of consumption, the size of this effect is small. It will be important to determine to what extent this is a clinically meaningful effect.

Although the authors claim that their findings suggest that the “provider of interventions may matter” (with nurses providing the best results) there is only weak evidence for this. As the categorisation of studies by provider (and setting and content for that matter) didn’t really have any impact on the heterogeneity (as measured by I2) between studies, there is little evidence that the effectiveness of ABIs differed meaningfully across providers.

Interventions delivered by nurses appeared the most effective, although further work is needed to confirm this finding.

Interventions delivered by nurses appeared the most effective, although further work is needed to confirm this finding.

Strengths and limitations

Strengths

As the authors used a multi-level meta-analysis, they were able to include all relevant outcomes into their analysis, rather than just picking one outcome (and consequently having to exclude studies which did not assess this outcome). This is also likely to have reduced study level heterogeneity.

Limitations

As the authors were interested in the difference in effectiveness of a range of different ABI settings, providers and contents, the number of studies included within each of these categories was small. This makes drawing firm conclusions regarding the effectiveness of particular forms of ABIs difficult.

Implications

Given that there is little evidence to suggest that the effectiveness of alcohol brief interventions differs meaningfully according to setting, provider or content, the authors do note that this indicates that resources should be allocated to those settings, providers and contents where ABIs are likely to be most cost-effective and feasible.

For example, A&E may not be the best setting for ABIs given the lack of privacy, the brevity of the visit and the fact that the patient is likely to be suffering from a severe injury at the time.

Nurses are likely to be well placed to provide ABIs given their repeated contact with patients, although appropriate training should be provided to nurses so that they can embed these practices into their care.

Focusing on interventions that are feasible and cost-effective seems like the biggest practical advice from this evidence.

Focusing on interventions that are feasible and cost-effective seems like the biggest practical advice from this evidence.

Links

Primary paper

Platt L, Melendez-Torres GJ, O’Donnell A, Bradley J, Newbury-Birch D, Kaner E, et al. (2016) How effective are brief interventions in reducing alcohol consumption: do the setting, practitioner group and content matter? Findings from a systematic review and metaregression analysis. BMJ Open. 2016;6(8).

Other references

HM Government (2012) The Government’s Alcohol Strategy PDF. CM 8336, March 2012.

Photo credits

New alcohol guidelines: what you need to know

by Olivia Maynard @OliviaMaynard17

This blog originally appeared on the Mental Elf site on 9th Febraury 2016.

Last month the UK Chief Medical Officers (CMOs) published new guidelines for alcohol consumption. These are the first new guidelines since 1995 and are based on the latest evidence on the effects of alcohol consumption on health.

The guidelines provide recommendations for weekly drinking limits, single drinking episodes and recommendations for pregnant women, drawing heavily on the Sheffield Alcohol Policy Model, which uses the most up to date evidence on both the short- and long-term risks of alcohol.

What are the new guidelines?

Guidelines for weekly drinking

For the new weekly drinking guidelines, the CMOs recommend that:

  • It’s safest for both men and women to not regularly drink more than 14 units of alcohol per week;
  • It’s best to spread these units over 3 days or more;
  • Having several drink-free days each week is a good way of cutting down the amount you drink;
  • The risk of developing a range of illnesses increases with any amount you drink on a regular basis.

There are two key changes here from the guidelines we’ve been used to:

First, there’s no difference in recommendations for men and women. This is because there is increasing evidence that although women are more at risk from the long-term health effects of alcohol, men are more at risk from the short-term effects of drinking (they’re more likely to expose themselves to risky situations while drinking).

Second, there is an explicit statement that there is no ‘safe’ level of alcohol consumption. Over the past 21 years, the link between alcohol and cancer has become much clearer. For example, we now know that while the lifetime risk ofbreast cancer is 11% among female non-drinkers, the lifetime risk for a woman drinking within the new guidelines is 13%. A woman drinking over 35 units a week increases her risk of breast cancer to 21%.

In their report, the CMOs are also at pains to point out that the evidence supporting alcohol’s protective effects on ischaemic heart disease is now weaker than in 1995. Furthermore, any potential protective effect of alcohol is mainly observed among older women at very low levels of consumption. Previously some have used this to claim that drinking is better than abstinence – the new guidelines refute this.

The new guidance says it's safest for men and women to drink no more than 14 units each week.

The new guidance says it’s safest for men and women to drink no more than 14 units each week.

Guidelines for single drinking episodes

The new guidelines are the first to provide guidance on drinking on single occasions, recommending drinkers:

  • Limit the total amount consumed on any occasion;
  • Drink slowly, with food and alternating with water;
  • Avoid risky places and activities and ensure they have a safe method of getting home.

These new recommendations reflect the fact that many alcohol consumers may drink heavily on occasion and provide guidance to avoid the risk of injury and ischaemic heart disease which increase with heavy drinking.

Heavy drinking episodes are linked with a higher risk of injury.

Heavy drinking episodes are linked with a higher risk of injury.

Guidelines for drinking during pregnancy

The new guidelines suggest that:

  • The safest approach for pregnant women is not to drink alcohol at all, to keep risks to the baby to a minimum.
  • Drinking during pregnancy can lead to long-term harm to the baby, with the risk increasing with the more alcohol consumed;
  • The risk of harm to the baby is likely to be low if a woman has drunk only small amounts of alcohol before she knew she was pregnant or during pregnancy.

The CMOs report that while the evidence on the effects of low alcohol consumption during pregnancy remains ‘elusive’, taking a precautionary approach is most prudent when it comes to a baby’s long term health. However, given the elusive evidence, the guidance is also careful to note that mothers should not be too concerned if they have drunk early in their pregnancy, as this kind of stress may be even more harmful to the developing baby.

Pregnant women are advised not to drink alcohol at all.

Pregnant women are advised not to drink alcohol at all.

A note on risk

These recommendations are based on a level of alcohol consumption which confers a 1% lifetime risk of death from alcohol. Their purpose is therefore tominimise risk from alcohol, rather than eliminate it. Indeed, the guidelines explicitly state that there is no safe level of alcohol consumption. So what does a 1% lifetime risk mean and how does this compare to other health behaviours?

Lifetime mean risks

  • Being killed through BASE jumping (0.3%);
  • Being killed in a car accident (0.4%);
  • Being diagnosed with bowel cancer from eating three rashers of bacon every day (1%);
  • Dying from an alcohol related disease, if drinking within the new guidelines (1%);
  • Smokers dying from a smoking related disease (50%, although new estimates suggest that this may be as high as 67%).

Put in the context of smoking, the risk posed by drinking within the new guidelines seems tiny (although it’s still more risky than BASE jumping!) However, it’s important to note that alcohol consumption and smoking are quite different. Alcohol consumption is perceived as normal in our society and is much more prevalent than cigarette smoking. By contrast, the acceptability of smoking is reducing and unlike social alcohol consumers, smokers are constantly being told to quit smoking.

This 1% risk level is that which is deemed ‘acceptable’ by the CMO. However, everyone will have a different ‘acceptable’ level of risk, which depends in part on how much pleasure is obtained from drinking. While some will think that increasing their risk of death from alcohol to 5% is acceptable, others will not accept any risk and will use these guidelines to cut out alcohol completely.

Criticisms of the new guidelines

As expected, the ‘nanny state’ criticism has been bandied around in pubs, on message boards and on social media since the publication of these guidelines. Others claim that these new guidelines are simply scaremongering. However, it’s important to remember that these are recommendations, not rules.

The last word must go to CMO Professor Dame Sally Davies, who addressed this criticism by saying that:

What we are aiming to do with these guidelines is give the public the latest and most up- to-date scientific information so that they can make informed decisions about their own drinking and the level of risk they are prepared to take.

What do you think? Are these new guidelines useful? Will they help reduce alcohol related harm?

What do you think? Are these new guidelines useful? Will they help reduce alcohol related harm?

Links

Primary paper

Department of Health (2016) Health risks from alcohol: new guidelines. Open Consultation, 8 Jan 2016 (Consultation closes on 1 April 2016)

Department of Health (2016). Alcohol Guidelines Review – Report from the Guidelines development group to the UK Chief Medical Officers.

Other references

Centre for Public Health (2016). CMO Alcohol Guidelines Review – A summary of the evidence of the health and social impacts of alcohol consumption. Liverpool John Moores University.

Centre for Public Health (2016). CMO Alcohol Guidelines Review – Mapping systematic review level evidence. Liverpool John Moores University.

Department of Health (1995). Sensible drinking: Report of an inter-departmental working group.

Photo credits


A behavioural insights bar: How wine glass size may influence wine consumption

by Olivia Maynard @OliviaMaynard17

Now that the festive season is almost upon us, I’ve been wading through the list of jobs I’ve been putting off for longer than I can remember, with the hope of starting afresh in 2016.

One of these jobs is wrapping up some of the studies I’ve been running this year, tidying up the data files and deciding what to do with the results. Obviously it’s best practice to write up all studies for publication in peer-reviewed journals, but sometimes this isn’t possible straight away (for example, when we’ve collected pilot data which will inform larger studies or research grants), although journals specifically for pilot and feasibility work do exist. However, it’s still important to share the findings, at the very least to prevent other research groups from running exactly the same pilot study (avoiding the file drawer effect).

The pilot study I’m trying to wrap up was conducted in September this year and is worth reporting, not only because the research is interesting, but also because the method of data collection was novel.

In December 2014 we were approached by the Behavioural Insights Team (BIT), who asked whether we’d be interested in running an experiment at their annual conference. Alongside a star-studded list of speakers, the BIT had planned to demonstrate to conference delegates the power of behavioural insights, by running a series of mini-experiments throughout the conference. We were asked to contribute, not only because I had previously worked in the BIT as part of a placement during my PhD, but also because of TARG’s track record in running behavioural experiments to influence alcohol consumption, both in the lab and in the ‘real-world’.

glassThe team asked us to run an experiment in the Skylon bar in the Royal Festival Hall – the venue of the conference drinks reception. After an initial assessment of the bar (yes, this is a tough job!) and discussing various possible experiments we could conduct, we finally decided to examine the impact of glass size on alcohol consumption. While considerable previous research has shown that plate size is an important driver in food consumption, and we have shown that glass shape (i.e., curved versus straight) influences alcohol consumption, there is very little research on the impact of glass size on alcohol consumption. Larger wine glasses are increasingly common and these may increase wine consumption and drinking speed by suggesting larger consumption norms to consumers, or by tricking consumers into thinking there’s a smaller amount in the glass than in a smaller glass which is equally full.

The primary aim of this pilot study was to determine the feasibility of implementing a glass size intervention study in a real-world drinking environment in order to inform future studies in this area.

Method

Prior to starting the study, as with every TARG study, we published the protocol online on the Open Science Framework. Depending on the side of the bar they were stood in, delegates attending the drinks reception were provided with either a small or a large wine glass, each of which was filled to the same volume. Every 15 minutes we counted the number of delegates on the two sides of the bar and every hour (for three hours) we counted the number of empty wine bottles on each side of the bar. We calculated the average volume of wine consumed per delegate each hour and then compared these between the two groups.

Results

From a feasibility point of view, the study worked as well as expected. Follow-up interviews with the manager of the bar indicated that bar staff enjoyed the process of participating in a study and were happy to participate again in future studies.

However, because we were conducting this in the real-world, rather than in our carefully controlled laboratory environment, we encountered a few logistical challenges. Here are the key points we learned from running this pilot study:

  1. In the real-world, there’s a necessary trade-off between collecting the data and not disrupting normal behaviour

bottles

Ideally we would have counted the number of empty bottles more frequently than every hour in order to get a more accurate measure of how much was consumed by the delegates. However prior to the start of the study, the bar manager suggested that this would interfere with their service and the bar staff reiterated this after the study had finished. As the bar staff were vital to the success of this pilot study, we didn’t think it was appropriate to push for more data collection than they felt comfortable with.

  1. Complete control of the environment isn’t possible in the real-world

controlkey

To prevent delegates from moving between the two sides of the bar we placed physical barriers between them, such as sofas, plants and lamps. However, inevitably, some delegates who wanted to ‘work the room’ at what was essentially a networking event did make their way past the barriers we set up. Other than instructing the waiters to replace the glass of those who had moved sides with the glass size appropriate for the side of the bar they were now in, there was very little we could do about this, short of frog-marching delegates back to their original side (which we thought wouldn’t go down very well on this occasion!)

  1. Accurate enforcement of study conditions is more difficult in the real-world

pouring

If we had conducted this study in the laboratory, we would have randomised participants to receive one of two glass sizes and carefully poured the exact volume of wine into their glass. In this real-world study, however, we had to rely on the waiters to accurately pour the wine into the glasses. Although highly trained, the waiters may also have fallen foul of the visual illusion the different glasses present (an effect which has been shown in previous real-world experiments). Future studies could monitor waiter pouring behaviour before and during the study.

  1. Studies in real bars have some other unexpected challenges…

full glassess

The BIT had asked that we present the results at 9am the following morning, allowing a nine hour turnaround from the end of the study to data presentation. This time pressure was not helped by the large quantities of complimentary champagne being served at the event, which considerably slowed down data entry and analysis at midnight!

Despite this substantial challenge, the results of the study were presented the following morning.

These data suggested that there was no difference in volume of wine consumed between the groups drinking from larger glasses and those drinking from table
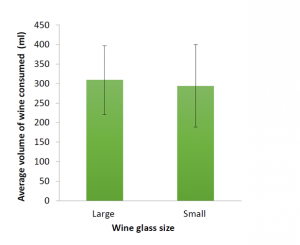
smaller glasses. As this study wasn’t powered to detect a meaningful difference between the two groups, we weren’t really surprised by this finding. However, these pilot data, along with the lessons learned from conducting the study will be used to inform our future research studies and grant applications.

And there we have it – another pilot study out of the file drawer and another item crossed off my ‘to-do’ list.

I’d like to thank the entire Behavioural Insights Team, in particular Ariella Kristal and Gabrielle Stubbs, for making this study happen, Carlotta Albanese from the Skylon bar and David Troy and Jim Lumsden from TARG for helping with all the data collection (and data entry at midnight).

Screening of A Royal Hangover: TARG goes to the movies

By David Troy @DavidTroy79 

I recently hosted a documentary screening of ‘A Royal Hangover’ on behalf of the Tobacco and Alcohol Research Group at the University of Bristol. The film documents anecdotes from all facets of the drinking culturpic1e in the UK, from politicians to police, medical specialists to charities, the church and scientists, and addicts and celebrities, with high profile personalities such as Russell Brand and controversial figures such as sacked Government Drugs Advisor Professor David Nutt. The director Arthur Cauty kindly agreed to take part in a question and answer session after the film to discuss his experience making the film and debate the issues raised in the film.

The film begins with Arthur talking about his own relationship with alcohol (or his lack of one).  He preferred to shoot silly films, play music or wrestle than go out drinking with his friends. The film deals with the history of alcohol starting off in the 16th and 17th century when it was safer to drink beer than water. Even babies were given what was called “small beer for small people”. In the early 18th century, gin became the drink of choice and reached epidemic levels, famously depicted in William Hogarth’s ‘Gin Lane’. pic2Gin was unregulated and sold not just in public houses but in general stores and on the street. Moving on to the 20th century, Lloyd George recognised the danger of alcohol to the war effort in World War 1, and was quoted as saying that “we are fighting Germany, Austria and drink; and as far as I can see, the greatest of these deadly foes is drink”. Around this time, restrictions on the sale of alcohol were introduced by government. During World War 2, beer was seen as important to morale and a steady supply of it was seen as important to the war effort. Since then, we have seen a steady increase in consumption levels through the ‘hooligan/lager lout’ phenomenon of the 1980’s and the binge drinking of the 1990’s and the early 2000’s. Consumption levels have been falling slightly since the mid 2000’s but there are still 10 million people drinking above the government’s recommended level.

During the film, Arthur investigates how different societies treat alcohol. French and American drinkers describe a more reserved and responsible attitude to alcohol. This is somewhat contradicted by 2010 data in a recent report by the World Health Organisation which reports that French people over the age of 15 on average consume 12.2 litres of pure alcohol a year compared to Britons at 11.6 and Americans at 9.2 litres respectively. The drinking culture of France and the United States is certainly different to that of the UK. The French consume more wine, less beer, and tend to drink alcohol whilst eating food. The US (outside of ‘Spring Break’ culture) is more disapproving of public intoxication. However, neither society should be held up as a gold standard when it comes to alcohol use.

The film talks about the enormous cost of alcohol to England; approximately £21 billion annually in healthcare (£3.5 billion), crime (£11 billion) and lost productivity (£7.3 billion) costs. These are the best data available, but costs of this nature are difficult to calculate. Arthur talked to professionals on the front line – he interviewed a GP who said that a huge proportion of her time is devoted to patients with alcohol problems and their families. She has to treat the “social and psychological wreck” that comes when one family member has an alcohol addiction. A crime commissioner from Devon and Cornwall police states that 50% of violence is alcohol-related in his area.

The film attempts to understand the reasons why alcohol use is at current levels, and offers some possible solutions. Alcohol is twice as affordable now as in the 1980’s and is more freely available than ever. This needs to be curtailed. Evidence suggests that alcoholic beverages were 61% more affordable per person in 2012 than in 1980, and the current number of licensed premises in England and Wales is at the highest level repic3corded in over 100 years. Licensed premises with off sales only alcohol licences have also reached a record high, more than doubling in number compared with 50 years ago. The evidence shows that price increases and restrictions on availability are successful in reducing alcohol consumption. More alcohol education in schools was highlighted as being necessary. The evidence suggests that alcohol education in schools can have some positive impact on knowledge and attitudes. Overall, though, school-based interventions have been found to have small or no effects on risky alcohol behaviours in the short-term, and there is no consistent evidence of longer-term impact. Alcohol education in schools should be part of the picture but other areas may prove more fruitful. The film suggests that parental and peer attitudes towards alcohol affect drinking norms, and these attitudes need to change. In multiple surveys, it has been found that the behaviour of friends and family is the most common influential factor in determining how likely and how often a young person will drink alcohol. Alcohol marketing was cited as a problem and it needs to regulated more stringently. Alcohol marketing increases the likelihood that adolescents will start to use alcohol and increases the amount used by established drinkers, according to a report commissioned by the EU. The exposure of children to alcohol marketing is of current concern. A recent survey showed that primary school aged children as young as 10 years old are more familiar with beer brands, than leading brands of biscuits, crisps and ice-cream.

David Nutt discussed research he conducted with colleagues, which assessed the relative harms of 20 drugs, including both harms to the individual and to others. They found that alcohol was the most harmful drug overall. Professor Nutt also covered the circumstances surrounding his sacking as government’s chief drug advisor; he claimed that ecstasy and LSD were less dangerous than alcohol, which led to his dismissal. This highlights the inherent tension between politics and science. Evidence can diverge from government policy and popular opinion, and scientists can lose their positions when reporting evidence that is politically unpopular. In my view, the reluctance of governments to implement evidence-based alcohol policies is frustrating; minimum unit pricing (MUP) being the latest example. Despite good evidence supporting how MUP can reduce alcohol-related harms, lobbying by the alcohol industry has halted its progress.

The film deals with the human cost of alcohol misuse, with personal stories of addiction permeating the film. Carrie Armstrong (who writes a blog discussing her battle with alcohol addiction), as well as Persia Lawson and Joey Rayner (who write a lifestyle blog ‘Addictive Daughter’), discussed the havoc alcohol caused in their lives, and explained how young men and women come to them for help with their own alcohol dependencies. Russell Brand talked about his own alcohol addiction during the film. He contends that his drug and alcohol use was medicinal and thinks that alcohol and drug addicts “have a spiritual craving, a yearning and we don’t the language, we don’t have the code to express that in our society”. Arthur interviewed Chip Somers of Focus 12, who talked about the low levels of funding to treat alcohol addiction. Only a small minority (approximately seven per cent) of the 1.6 million alcohol dependants in the UK can get access to treatment compared to two-thirds of addicts of other drugs.

pic4

Arthur recorded over 100 hours of footage of drinkers on nights out during the course of filming. He described it as follows: “As the sun goes down, society fades away and what emerges from the shadows is a monster of low inhibition, aggression and casual chaos”. He sums it up as us “going to war on ourselves. On one side is the police, the emergency services, the council and various groups of volunteers and on the other side you’ve got everybody else”. He was assaulted three times and witnessed multiple scenes of violence close up. His bravery is admirable – there were many scenes I found difficult to watch. The scenes of senseless violence were horrible to look at, as were the images of individuals who were so intoxicated as to be helpless and in need of medical attention.

The Q&A after the screening was quite illuminating. Arthur spoke about the reception the film has been receiving at home and abroad. The reception has been great in the United States, where the film has had successful showings at film festivals. The interest in the UK has been a little disappointing, however, which Arthur puts down to the reluctance of society at large to acknowledge our dysfunctional relationship with alcohol. Nevertheless, there has been positive feedback from viewers of the film. Many people have contacted Arthur to tell him how the film has opened their eyes to their own relationship with alcohol and prompted them to make a change. The audience was keen to engage in the conversation. One person, who has a family member with an alcohol addiction, said how important it is to raise awareness of these issues. Another person called for policy measures to be implemented such as MUP to curb use across the population.

pic5

Arthur came across as someone who is acutely aware of the damage alcohol is causing in the UK, and is doing what he can to raise the public’s consciousness about it. He has presented a unique look at booze Britain, in equal parts shocking, hilarious, sympathetic and thought provoking – a film we can all relate to. It was a very enjoyable and informative evening and I hope the audience took something away from it. I believe the arts and sciences need to work together to improve how knowledge is communicated. It was my hope that by showing this documentary, information on alcohol harms in society would be more accessible to a general audience. Change begins with the acknowledgement of new information that alters the view of ourselves and our behavior. It has been estimated that over 7 million people in the UK are unaware of the damage their personal alcohol use is doing. I believe the blame lies on both sides. Alcohol researchers need to communicate the harms of alcohol in more engaging and accessible ways and members of the general public need to seek out such information. All too often scientists get the reputation as being cold, boring, and amoral. Collaborating with filmmakers and other proponents of the arts on events such as the one I hosted can assist in changing that stereotype.

Is moderate alcohol consumption good for you?

By Marcus Munafo @MarcusMunafo 

This blog originally appeared on the Mental Elf site on 13th March 2015

wine

This is something many of us would like to be true – the idea that the occasional glass of wine has health benefits is compelling in a society like the UK where alcohol consumption is widespread.

Certainly the observational data indicate a J-shaped associationbetween alcohol consumption and mortality (O’Keefe et al, 2007), with the lowest mortality observed at low to moderate levels of alcohol consumption (equivalent to perhaps a pint of beer a day for men, and about half that for women).

However, observational studies like this are fraught with difficulties.

  1. First, people may not report their alcohol consumption reliably.
  2. Second, and more importantly, alcohol consumption is associated with a range of other lifestyle behaviours, such as diet and smoking, which will themselves influence mortality, so that isolating any specific association of alcohol is extremely difficult.
  3. Third, how non-drinkers are defined may be important – lifetime abstainers may be different from former drinkers (who could have stopped drinking because of health problems).

The last point illustrates the problem of reverse causality; alcohol consumption may be causally associated with a range of health outcomes, but some of those health outcomes may also be causally associated with alcohol consumption.

In a recent study in the BMJ, the authors argue that the problems associated with the choice of an appropriate referent group of non-drinkers are often overlooked in research into alcohol-related mortality.

They also argue that age is not adequately considered, which may be relevant because of physiological changes to the ageing body that influence elimination of blood alcohol. Knott and colleagues explored the association between alcohol consumption and all cause mortality for people aged less than 65 years and aged 65 or more, and separated never and former drinkers.

The lowest mortality observed is at low to moderate levels of alcohol consumption (equivalent to perhaps a pint of beer a day for men, and about half that for women).

Methods

The authors used data from the Health Survey for England, an annual, nationally-representative cross sectional survey of the general population, linked to national mortality registration data.

The analysis focused on adults aged 50 years or older, and investigated two measures of alcohol consumption: self-reported average weekly consumption over the past year, and self-reported consumption on the heaviest day in the past week. The outcome was all cause mortality (i.e., any death recorded during the period of data collection).

The primary statistical analyses were proportional hazards analyses for each of the two age groups of interest (less than 65 years and 65 years or more). They tested for whether any associations observed differed between males and females and, given strong evidence of a sex-dose interaction, reported sex-specific models for each age group of interest.

Statistical adjustment was made for a comprehensive list of potential confounders, such as geographical location, ethnicity, cigarette smoking, obesity and a range of socio-demographic variables.

Results

Protective associations were only observed with statistical significance (a point I’ll return to below) among younger men (aged 50 to 64 years) and older women (65 years or older), using a never drinker referent category after full adjustment.

Among younger men a protective relationship between alcohol consumption and all cause mortality was observed among those who reported consuming 15.1 to 20 units per week (hazard ratio 0.49, 95% confidence interval 0.26 to 0.91).

Among older women, the range of protective use was broader but lower, with reductions in hazards of all cause mortality observed at all consumption levels up to 10 units per week of less.

The study supports a moderate protective effect of alcohol.

Conclusions

The authors conclude that observed associations between low levels of alcohol consumption and reduced all cause mortality may in part be due to inappropriate selection of a referent group (all non-drinkers, rather than never drinkers) and inadequate statistical adjustment for potential confounders.

They also conclude that beneficial dose response relationships between alcohol consumption and all cause mortality may be specific to women aged 65 years or older.

There is a relative lack of data on older populations in relation to the association between alcohol consumption and all cause mortality, which this study addresses. The consideration of different definitions of the referent category is also valuable – the authors are correct that conventional definitions of “non-drinker” may be problematic.

However, to what extent should we believe the conclusion that beneficial dose response relationships may be age- and sex-specific?

As David Spiegelhalter has pointed out, the authors base their conclusion on which associations achieved statistical significance and which did not. However, the hazard ratios for all cause mortality are consistently lower for alcohol consumers than non-consumers in this study. Although the confidence intervals are wider for some consumption levels and in some sub-groups (males vs females, or younger vs older), the individual hazard ratios are all consistent with each other.

The wide confidence intervals reflect a lack of statistical power, principally due to the small number of never drinkers, and the small number of deaths. Although the data set is relatively large, by carving it up into a number of sub-groups, the statistical power for the individual comparisons is reduced. Spiegelhalter points out that the entire comparison for participants in the younger age group is based on 17 deaths in the male baseline group and 19 deaths in the female group.

As Andrew Gelman and Hal Stern have said, the difference between “significant” and “non-significant” is not (necessarily) itself significant. Indeed, focusing on statistical significance (rather than effect size and precision) can lead to exactly the problems encountered here. Low statistical power is also a problem, reducing the likelihood that a statistically significant finding is true, and (perhaps more importantly) dramatically reducing the precision of our effect size estimates.

Should we believe that beneficial dose response relationships are age- and sex-specific?

Strengths and limitations

There are some strengths to this study, notably the use of a more considered referent category of never drinkers, and the statistical adjustment for a broad range of potential confounders.

However, the primary conclusion of the authors does not seem to be borne out by their own data – hazard ratios for all cause mortality are lower for alcohol consumers than non-consumers at all levels of consumption, for both men and women, and for both the younger and older age groups.

Is moderate alcohol consumption good for us then? The observational data, including that from this study, continues to suggest so.

However we should also remain wary of evidence from observational studies, which can be notoriously unreliable, and cannot confirm that an association is causal. Ultimately, we may need to use novel methods to answer this question, such as Mendelian randomization which utilized the properties of genetic variants to enable stronger causal inference.

We should be wary of evidence from observational studies, which can be notoriously unreliable, especially in underpowered studies like this one.

Link

Knott CS, Coombs N, Stamatakis E, Biddulph JP. (2015) All cause mortality and the case for age specific alcohol consumption guidelines: pooled analyses of up to 10 population based cohorts (PDF). British Medical Journal, 350, h384. doi: 10.1136/bmj.h384

O’Keefe HF, Bybee KA, Lavie CJ. (2007) Alcohol and cardiovascular health: the razor-sharp double-edged sword. J Am Coll Cardiol. 2007;50(11)

Spiegelhalter D. (2015) Misleading conclusions from alcohol protection study. Understanding Uncertainty website, last accessed 11 Mar 2015.

Reducing alcohol consumption in illicit drug users: new Cochrane review on psychotherapies

By Olivia Maynard @OliviaMaynard17

This blog originally appeared on the Mental Elf site on 28th January 2015

shutterstock_3084226

Whilst we all know that excessive alcohol consumption is bad for our health, illicit drug users are one group for whom problem alcohol use can be especially harmful, causing serious health consequences.

The prevalence of the hepatitis C virus is high among illicit drug users and problem alcohol use contributes to a poorer prognosis of this disease by increasing its progression to other diseases. In addition, rates of anxiety, mood and personality disorders are higher among illicit drug users, each of which is exacerbated by problem alcohol use.

Despite these health consequences, the prevalence of problem alcohol use is high among illicit drug users, with around 38% of opiate- and 45% of stimulant-using treatment-seeking individuals having co-occurring alcohol use disorders (Hartzler 2010; Hartzler 2011).

Previous Cochrane reviews have investigated the effectiveness of psychosocial interventions (or ‘talking therapies’) for either problem alcohol use, or illicit drug use alone. However, none have investigated the effectiveness of these therapies for individuals with concurrent problem alcohol and illicit drug use. Given the significant health risk and the high prevalence of concurrent problem alcohol and illicit drug use, a Cochrane review of this kind is long over-due.

Luckily, Kilmas and colleagues have done the hard work for us and their comprehensive Cochrane review of the literature evaluates the evidence for talking therapies for alcohol reduction among illicit drug users (Klimas et al, 2014).

This updated Cochrane review looks at psychotherapy for concurrent problem alcohol and illicit drug use.

The talking therapies we’re concerned with here are psychologically based interventions, which aim to reduce alcohol consumption without using any pharmacological (i.e. drug-based) treatments. Although there’s a wide range of different talking therapies currently used in practice, the ones which are discussed in this Cochrane review are:

  • Motivational interviewing (MI): this uses a client-centered approach, where the client’s readiness to change and their motivation, is a key component of the therapy.
  • Cognitive-behavioural therapy (CBT): this focuses on changing the way a client thinks and behaves. To address problem alcohol use, CBT approaches identify the triggers associated with drug use and use behavioural techniques to prevent relapse.
  • Brief interventions (BI): often BIs are based on the principles of MI and include giving advice and information. However, as implied by the name, BIs tend to be shorter and so are more suitable for non-specialist facilities.
  • The 12-step model: this is the approach used by Alcoholics Anonymous and operates by emphasising the powerlessness of the individual over their addiction. It then uses well-established therapeutic approaches, such as group cohesiveness and peer pressure to overcome this addiction.

Methods

  • The Cochrane review included all randomised controlled trials which compared psychosocial interventions with another therapy (whether that be other psychosocial therapies (to allow for comparison between therapies), pharmacological therapies, or placebo). Participants were adult illicit drug users with concurrent problem alcohol use
  • Four studies were included, involving 594 participants in total
  • The effectiveness of these interventions were assessed and the authors were most interested in the impact of these therapies on alcohol use, but were also interested in their impact on illicit drug use, participants’ engagement in further treatment and differences in alcohol related harms
  • The quality of the studies was also assessed

The quality of trials included in this review could certainly have been a lot better.

Results

The four studies were very different, each comparing different therapies:

  • Study 1: cognitive-behavioural therapy versus the 12-step model (Carroll et al, 1998)
  • Study 2: brief intervention versus treatment as usual (Feldman et al 2013)
  • Study 3: group or individual motivational interviewing versus hepatitis health promotion (Nyamathi et al, 2010)
  • Study 4: brief motivational intervention versus assessment only (Stein et al, 2002)

Due to this heterogeneity, the results could not be combined and so each study was considered separately. Of the four studies, only Study 4 found any meaningful differences between the therapies compared. Here, participants in the brief motivational intervention condition had reduced alcohol use (by seven or more days in the past month at 6-month follow up) as compared with the control group (Risk Ratio 1.67; 95% Confidence Interval 1.08 to 2.60; P value = 0.02). However, no other differences were observed for other outcome measures.

Overall, the review found little evidence that there are differences in the effectiveness of talking therapies in reducing alcohol consumption among concurrent alcohol and illicit drug users.

The authors of this review also bemoan the quality of the evidence provided by the four studies and judged them to be of either low or moderate quality, failing to account for all potential sources of bias.

The review found no evidence that any of the four therapies was a winner when it came to reducing alcohol consumption in illicit drug users.

Conclusions

So, what does this all mean for practice?

In a rather non-committal statement, which reflects the paucity of evidence available, the authors report that:

based on the low-quality evidence identified in this review, we cannot recommend using or ceasing psychosocial interventions for problem alcohol use in illicit drug users.

However, the authors suggest that similar to other conditions, early intervention for alcohol problems in primary care should be a priority. They also argue that given the high rates of co-occurrence of alcohol and drug problems, the integration of therapy for these two should be common practice, although as shown here, the evidence base to support this is currently lacking.

And what about the comparison between the different talking therapies?

Again, rather disappointingly, the authors report that:

no reliable conclusions can be drawn from these data regarding the effectiveness of different types of psychosocial interventions for the target condition.

How about the implications for research? What do we still need to find out?

This review really highlights the scarcity of well-reported, methodologically sound research investigating the effectiveness of psychosocial interventions for alcohol and illicit drug use and the authors call for trials using robust methodologies to further investigate this.

Choosing a therapy for this group of patients is difficult with insufficient evidence to support our decision.

Links

Klimas J, Tobin H, Field CA, O’Gorman CSM, Glynn LG, Keenan E, Saunders J, Bury G, Dunne C, Cullen W. Psychosocial interventions to reduce alcohol consumption in concurrent problem alcohol and illicit drug users. Cochrane Database of Systematic Reviews 2014, Issue 12. Art. No.: CD009269. DOI: 10.1002/14651858.CD009269.pub3.

Hartzler B, Donovan DM, Huang Z. Comparison of opiate-primary treatment seekers with and without alcohol use disorderJournal of Substance Abuse Treatment 2010;39 (2):114–23.

Hartzler B, DonovanDM,Huang Z. Rates and influences of alcohol use disorder comorbidity among primary stimulant misusing treatment-seekers: meta-analytic findings across eight NIDA CTN trialsThe American Journal of Drug and Alcohol Abuse 2011;37(5):460–71.

Carroll, K.M., Nich, C. Ball, S.A, McCance, E., Rounsavile, B.J. Treatment of cocaine and alcohol dependence with psychotherapy and dislfram. Addiction 1998; 93(5):713-27. [PubMed abstract]

Feldman N, Chatton A, Khan R, Khazaal Y, Zullino D. Alcohol-related brief intervention in patients treated for opiate or cocaine dependence: a randomized controlled studySubstance Abuse Treatment, Prevention, and Policy 2011;6(22):1–8.

Nyamathi A, Shoptaw S,Cohen A,Greengold B,Nyamathi K, Marfisee M, et al. Effect of motivational interviewing on reduction of alcohol useDrug Alcohol Dependence 2010;107(1):23–30. [1879–0046: (Electronic)]

Stein MD, Charuvastra A, Makstad J, Anderson BJ. A randomized trial of a brief alcohol intervention for needle exchanges (BRAINE). Addiction 2002;97(6):691. [:09652140] [PubMed abstract]

Mikhail Pogosov / Shutterstock.com

– See more at: http://www.thementalelf.net/mental-health-conditions/substance-misuse/reducing-alcohol-consumption-in-illicit-drug-users-new-cochrane-review-on-psychotherapies/#sthash.DgftSUSM.dpuf

Alcohol minimum unit pricing: time to take action?

By Olivia Maynard @OliviaMaynard17

This blog originally appeared on the Mental Elf site on 3rd October 2014

The UK government’s minimum pricing policy for alcohol has been hotly debated over the last couple of years and this week a new study describing the potential benefit of minimum unit pricing over the governments’ current ban on below cost selling has started sparks flying once more.

In the paper, published on Wednesday in the British Medical Journal (BMJ), Brennan and colleagues (2014) use sophisticated modelling to compare the expected effects of the two policies on the following outcomes:

  • Alcohol consumption
  • Health harms, including deaths, illness, admissions to hospital, quality of life and costs to the NHS
  • Drinkers’ expenditure
  • Tax and duty revenues

However, before we get our teeth stuck into the study itself, what’s the difference between the two policies?

Minimum unit pricing is about setting a floor price (e.g. 45p) for a single unit of alcohol.

Minimum unit pricing is about setting a floor price (e.g. 45p) for a single unit of alcohol.

Minimum unit pricing (MUP)

  • A ‘unit’ of alcohol (roughly half a pint of low strength beer, a measure of spirits or half a regular sized glass of wine) would have to be sold at a set price, such as 45p
  • This policy was initially supported in 2012 by the UK government, but was later rejected
  • The Scottish government passed legislation to introduce MUP at 50p per unit in June 2012, but as yet this has not been introduced due to a legal challenge from the Scotch Whiskey Association which has now gone all the way to the European Court of Justice. The outcome of this legal challenge is not expected until late 2015
  • Canada, Russia and Uzbekistan have all introduced MUP

A ban on below cost selling (BBCS)

  • Alcoholic drinks must not be sold for less than the tax payable on the product
  • Under this policy, the price of alcohol does not necessarily increase with the strength of the alcohol and for drinks like high strength cider, a unit of alcohol can be sold for as little as 6p under this policy
  • The UK government favoured this policy over MUP in 2013 and introduced it in May 2014

The authors answer the following question in their study:

What would the differential potential impact of a BBCS versus a MUP policy of 40p, 45p or 50p if the policies were to be implemented in 2014-2015?

Despite once publicly supporting a minimum unit pricing of 40p. David Cameron's government has decided instead to put in place a ban on the sale of “below cost” drinks.

Despite once publicly supporting a minimum unit pricing of 40p. David Cameron’s government has decided instead to put in place a ban on the sale of “below cost” drinks.

Methods

As I said, the authors used some pretty sophisticated modelling techniques (using the Sheffield Alcohol Policy Model [version 2.5]) to answer their research question, but in brief, in order to work out the likely effects of these two alcohol policies, the following information was entered into the model:

  • Baseline data on:
    • Alcohol consumption for different population subgroups in England (split by sex, age, mean consumption level and income)
    • Prices paid for 10 different beverage types and quantity of each purchased, for the different subgroups
  • An estimate of the effect that price increases for these 10 beverages would have on consumption levels for the subgroups (given that different subgroups spend and drink different amounts of the 10 beverages)
  • The effects of this estimated change in consumption on death and disease rates at one and 10 years post implementation

Results

Given that harmful drinkers are a policy priority group, (consuming on average 58 units for females and 80 for males per week and spending £1,800 and £3,400 per year respectively), the authors focus in particular on the effects of the two policies on this group. Also, whilst MUP at 40p, 45p and 50p were all assessed, I will focus on MUP at 45p, as this is the level initially proposed by the UK government.

Proportion of the market affected by the policies

  • Under a BBCS, only 0.7% of all units of alcohol sold in the UK would see a price increase, whilst MUP would affect 23.2% of all units sold
  • MUP would disproportionately affect harmful drinkers, increasing the price of 30.5% of the units they purchase, as compared with only 12.5% of units purchased by moderate drinkers

Alcohol consumption

  • A BBCS was estimated to reduce the number of units consumed by harmful drinkers by only 3 units per year
  • By contrast, MUP was estimated to reduce this by 137 units; a 45-fold reduction as compared with a BBCS

Health harms, including deaths, admissions to hospital, quality of life and costs to the NHS

  • The estimated effects on the general population of the two policies after 10 years of implementation are shown below:
BBCS MUP
Annual reduction in number of deaths 14 624
Annual reduction in hospital admissions 500 23,700
Annual reduction in alcohol-related illness 300 12,500
Total number of quality adjusted life years gained 500 24,200
Total saving in healthcare costs £9.5 million £417.2 million
  • Based on these estimates, MUP will reduce deaths attributable to alcohol by 40 times more than BBCS
  • The majority of this harm reduction is likely to be among harmful drinkers, with 89% of the reduction in deaths after 10 years among this group

The study findings suggest that harmful drinkers would be helped most by minimum unit pricing

The study findings suggest that harmful drinkers would be helped most by minimum unit pricing.

Drinkers’ expenditure

  • Due to the high price elasticity of alcohol (higher prices mean people lower their consumption to a level which ensures they continue to spend the same amount) neither policy is expected to greatly affect spending

Tax and duty revenues

  • A BBCS is estimated to increase revenues in shops and supermarkets by 0.3% (£5.4m)
  • By contrast, MUP is estimated to result in a 5.6% (£201.1m) increase in revenues, although the effects on actual profits is unknown
  • The effects of the two policies on government tax revenue is small, as although VAT will rise (because this is charged as a percentage of product price and products will be sold at higher prices), alcohol duty revenue will fall (as this is related to the volume of alcohol sold)

Discussion

Professor Alan Brennan, professor of Health Economics and Decision Modelling at the University of Sheffield, who led the study said:

Despite some study limitations we found that a minimum unit price of 45p would be expected to have 40-50 times larger reductions in consumption and health harms.

The limitations Professor Brennan alludes to include the fact that certain assumptions about alcohol price elasticity and actual alcohol consumption and expenditure had to be made in order to run the model. However, the authors state that the sensitivity analyses they have conducted show that the relative scale of the impact of a BBCS versus MUP is robust to these assumptions and uncertainties and, if anything, the scale of the difference is likely to be conservative.

In the editorial accompanying the paper (Stockwell, 2014), Tim Stockwell, the director of the Centre for Addictions Research at the University of British Columbia, Canada, notes that one way to test whether the model is conservative is to compare the model’s predicted effects with actual reported effects in a country where MUP has been introduced. Indeed, when the model is applied to two Canadian provinces with MUP policies, the model underestimates the number of deaths by 2.3 times and the number of hospital admissions by almost 5 times.

It seems therefore that the model is robust enough to assess the effects of the two policies and if anything, underestimates the true likely effect of MUP. These data suggest that MUP would be a far more effective method of reducing consumption and preventing alcohol related harm than the BBCS implemented earlier this year in the UK.

Minimum unit pricing in Canada has been associated with significant reductions in alcohol related harm

Minimum unit pricing in Canada has been associated with significant reductions in alcohol related harm.

Implications for policy

  • The UK government introduced a BBCS in May 2014
  • The Scottish legal case will likely pave the way for alcohol pricing policies in other EU jurisdictions interested in introducing MUP, including the Republic of Ireland, Estonia and regional governments in the UK
  • Given the potential effectiveness of MUP as compared with a BBCS, the outcome of this legal case is likely to have important implications for public health across Europe

Response from government, industry and others

Perhaps unsurprisingly, this study has not found favour among the alcohol industry, with Miles Beale, Chief Executive of the Wine and Spirits Association arguing that the government should not be “punishing responsible drinkers through higher prices”, a statement which seems at odds with the study’s results which shows that MUP would specifically target harmful drinkers. Indeed, this is what makes MUP different from more indiscriminate policies, such as general price or tax increases, which would indeed punish moderate drinkers.

By contrast, Sir Ian Gilmore, chairman of the Alcohol Health Alliance, warmly received the results of the study and urged Westminster politicians to back the Scottish plans for MUP and “help push it through the European Court of Justice for the good of the public’s health.”

However, the response from the Department of Health was lukewarm, with a spokeswoman reiterating the fact that the government is “taking action to tackle cheap and harmful alcohol such as banning the lowest priced drinks” and noting that the government is “working with industry to promote responsible drinking.”

This close relationship between UK government and the alcohol industry is well documented and alcohol industry lobbying has been cited as the main reason for the government U-turn on MUP in 2013 (Gornall, 2014). Unlike tobacco control policies in the UK, which are protected from the tobacco industry and other commercial interests through a World Health Organisation framework (WHO FCTC, 2005), this is not the case for alcohol policies. John Holmes, a Public Health Research Fellow at the Sheffield Alcohol Research Group, and one of the authors of this study, has previously acknowledged that the alcohol industry should have some say in alcohol policies, but that he is also concerned that the industry is “not particularly interested in . . . engaging in any kind of debate about whether their arguments are accurate. It’s all about creating doubt about what we’re saying.”

Whether the alcohol industry will continue to cast doubt on this research and whether the government will choose to listen to the researchers or the industry, remains to be seen.

In late 2015, the European Court of Justice will decide if the Scottish parliament’s 2012 legislation can be passed, which will have a massive impact on public health in Europe.

In late 2015, the European Court of Justice will decide if the Scottish parliament’s 2012 legislation can be passed, which will have a massive impact on public health in Europe.

Links

Brennan A, Meng Y, Holmes J, Hill-McManus D, Meier PS. (2014). Potential benefits of minimum unit pricing for alcohol versus a ban on below cost selling in England 2014: modelling studyBMJ, 349(g5452).

Gornall J. (2014). Under the influence: 1. False dawn for minimum unit pricingBMJ 2014;348:f7435.

Stockwell D. (2014). Editorial: Minimum unit pricing for alcoholBMJ, 349(g5617).

WHO FCTC. (2005). WHO Framework Convention on Tobacco Control (PDF). World Health Organisation.

Radu Bercan/Shutterstock.comPeter Fuchs/Shutterstock.com.

– See more at: http://www.thementalelf.net/mental-health-conditions/substance-misuse/alcohol-minimum-unit-pricing-time-to-take-action/#sthash.hAkkpG2g.dpuf

Welcome to the Real World

Dave Troy 

Taking laboratory studies into the ‘real world’ is every scientist’s nightmare. We love the lab – it’s where we feel safe, where we can control our world, our variables, our environment, and our interventions. However, lab studies can only tell us so much; eventually we need to know whether the findings from our lab studies apply in the real world. This is what the Tobacco and Alcohol Research Group (TARG) has endeavored to do. Findings in our lab suggest that individuals drink beer slower from a straight-sided glass compared to a curved glass. As a first step towards testing this effect in the real world, we carried out a small feasibility study to investigate whether a large-scale study might be possible. We needed to find out what outcome measure we could use to measure alcohol consumption, whether pubs and customers would be willing to take part, and what the logistical challenges of running a study of this nature might be. With this in mind, we contacted the owner of Dawkin’s Ales. He was open to the prospect of stocking three of his pubs (The Portcullis, Clifton Village; The Victoria, Clifton; and the Green Man, Kingsdown) with differently shaped pint glasses over a couple of weekends, using monetary takings as a proxy measure of the amount of alcohol consumed. He was extremely supportive of the endeavor and we would like to thank him for all his help. He seemed to be genuinely interested in the outcome of the study and in science in general. The feasibility study was a success: we showed that this type of drinking rate study can be carried out in a pub environment. However, there were some teething problems. Variables such as the size of a dishwasher caused unforeseen complications. Only when you get into the real world, do you realise how unstandardised it is.

Green Man Pub, Kingsdown

What we learned on our adventures in the real world is that communication is key. Cultivating good relationships with pub landlords and staff was vital to the success of the feasibility study. Naturalistic studies are unpredictable – nothing goes to plan. Good communication and rapport with stakeholders is vital and can assist in acquiring high quality data. Pub staff are also a great source of industry knowledge. We were educated on the extent of research by the drinks industry into the effect of different glass shapes on drinking behavior, which is extensive in their opinion. They were also full of ideas regarding what other experiments could be carried out. One of the landlords mentioned that people “drink with their eyes”, which piqued an interest in me about how our other senses may play a role in our drinking behaviour. Another comment was that people tend to drink more quickly when they are standing up. This hadn’t occurred to me before, but I was told that it has grabbed the attention of policy makers, who want to discourage ‘vertical drinking’ by demanding pub license holders supply more seating. Another topic that came up again and again is the use of “nucleated” beer glasses. These have marking at the bottom of beer glasses to promote the formation of bubbles, maintaining the head for longer. The importance attached to it by pub staff and customers suggests it might be an important factor in people’s drinking. All of these are ideas that we may take forward in our lab studies. Pub staff also made valuable suggestions on how to improve future pub studies. One landlady said that we should do it over a whole week to get a better picture of the cadence of an average drinking week.

Nucleation vs Non-nucleation

On a personal level, I learned more as an experimenter helping with this study than in all my previous lab studies. Perhaps surprisingly, the attention to detail and organisation required is above the requirements of a lab study. The logistics involved are greater and an ability to think on your feet is essential. The real world is a challenging place to do research but the advantages are clear. The data collected reflects more natural behavior of participants and therefore your findings have greater relevance. Activity that would have otherwise have gone unnoticed can be observed. Qualitative data collected can inform future research. Another advantage is that you can interact with professionals who have their ear to the ground, which can lead to ideas for new studies. There are also some challenges. There is a greater probability that an external variable, not controlled for in your study, has influenced your findings. Natural environments lack the control of lab studies. It may be difficult to replicate a study when there are so many variables at play. Nevertheless, lab and naturalistic studies complement each other and there is a need for both in science. Advances in technology, such as tablet computers and smartphones, have made acquiring vast amounts of data in the ‘real world’ much easier. Researchers in TARG will continue to engage with the public in natural settings in the future and hopefully capture data that will inform people’s lifestyles and public health policy.