Leaving the Lab: Rising to the Challenge of Remote Research

Written by Angela Attwood and Maddy Dyer

COVID-19 impact on research

The coronavirus (COVID-19) pandemic has forced millions of us to embrace remote working, and researchers are no exception. Universities are closed and face-to-face research with human participants has been temporarily halted. This has created challenges for our research, and laboratory and field studies are particularly affected.

As part of a large research group at the University of Bristol, we had to respond to this new situation and develop contingency plans for our research. Our first step was to review ongoing research and identify which studies could be suspended. We were fortunate on two counts: 1) we were able to put data collection on hold for many of our studies because there was enough flexibility in our planned completion times, and 2) we were able to stay busy with other work (such as analysing or writing up data from completed studies or developing new grant applications).

In all honesty, we would probably have stopped there with our contingency plans if it hadn’t been for one study that did not have this flexibility. This study investigates smokers’ experiences of switching to e-cigarettes, and requires participants to vape and complete various tasks across a two-week period. If we weren’t able to deliver on this study by a fixed deadline of the end of 2020, the funding would be withdrawn and one of our research staff would have been out of work. This forced us to think again…

Challenges and opportunities

There have been more challenges than opportunities in the context of the COVID-19 outbreak. However, one thing this global crisis has encouraged is innovation and creativity. We responded to the pressing need to complete this project by adapting our protocol so that the study could be run remotely (with no face-to-face communication). Some studies can move onto online platforms (and some of our changes include the use of online surveys), but our study involves participation over a two-week period with multiple “visits” and the use of electronic cigarettes. This required substantial adaption of the study methods (see below for some examples), but we were able to produce a comprehensive revision that retained the necessary components to ensure valid testing of our original research question.

We had to overcome several practical challenges, such as how to screen participants for smoking status and pregnancy. In the laboratory, we typically verify smoking status using a carbon monoxide (CO) breath monitor – equipment that cannot be used during lockdown. To overcome this, we replaced the CO monitor with a cotinine urine test, which verifies smoking status by detecting a metabolite of nicotine in urine. These are dipstick tests that participants can take themselves and we verify the outcome via a video call by asking them to show us the used dipstick.

Another challenge was how to safely deliver the e-cigarettes, e-liquids, and screening tests to participants. We are doing this via post (using pre-paid postage), with carefully constructed information packs and cleaning instructions. All test sessions that collect primary outcome data are now taking place online. This includes a cue reactivity procedure that participants are led through via pre-recorded instructions that link to our online study materials. We are also exploiting ecological momentary assessment methods (daily messaging via mobile phones) to collect real-time data across the test weeks, and all face-to-face communication has been replaced with phone and video calls. We worked closely with our faculty research ethics committee and university IT services as we developed this protocol to ensure any new ideas were feasible and ethically sound (or to identify problems early and seek alternative solutions).

Our aim was to complete a project that otherwise would not have been possible. However, the important learning point was that in developing essentially what was an “emergency response” protocol, we have unlocked other important benefits. Before the COVID-19 outbreak, our biggest challenge was recruiting participants (we require smokers who are willing to abstain from smoking for one week!). As with all university-based research, we often rely on opportunistic recruitment that means recruiting from the local area (i.e., people who can easily attend the laboratory sessions during university opening hours), and our samples often comprise a relatively high number of students. This not only means we have difficulty recruiting, but that our samples are not always representative, and our results may not generalise to the wider population. This new model of working means we have no geographical restriction (as long as the post delivers and there is Internet provision – we can collect data!), hugely improving our reach and the diversity in our participant samples.

Another benefit is that data are collected in more naturalistic settings (although this comes with a loss of control that needs to be considered or may not be appropriate for some studies). For studies that require participants to attend multiple sessions, it is also likely there will be lower attrition (i.e., fewer drop-outs) as there is less burden on participants to travel to a testing laboratory.

This has not been an easy transition (although we will certainly be well equipped to do it again if we need to). It has been time consuming, and some aspects of the study were simply not possible in the context of the fixed time constraints and funding in place, and without the laboratory facilities. The utility of this approach needs to be considered on a case by case basis. But, for our study, it was doable. We are only at the start of this process – the study will be running throughout 2020 and we look forward to the ongoing challenge and reflecting on how we can optimise this process in future.

The important take-home message is that remote research is not something we will discard after the COVID-19 restrictions are lifted. We will refine these methods and embrace the benefits they offer. Remote research will not be an emergency response option only, but instead it will be an integral part of our research toolkit.

If you are interested in finding out more, please visit our website:

http://www.bristol.ac.uk/psychology/research/brain/targ/participants/smoker-experience-ecigs/

You can also follow us on Twitter: @BristolTARG @AngelaAttwood @MaddyLDyer


Why I took part in the “Preregistration Challenge”

By Sarah Peters

The preregistration of study protocols has a long history in clinical trials, but is a more recent innovation in many other areas. The hope is that it will help counter the “reproducibility crisis” in psychological science – the failure of many published findings to replicate reliably. Here I discuss my experience with the Open Science Framework “Preregistration challenge”, and argue for more widespread adoption of preregistering reports.

There is an ongoing methodological crisis in psychological science – the reproducibility crisis refers to the failure of many scientific findings to be replicated. The Reproducibility Project, a recent initiative led by Professor Brian Nosek at the University of Virginia, aimed to identify the scale of this crisis. A large collaboration between 270 project members reran 100 published psychological experiments, and found that just 36% of the initial findings were replicated. Similarly, some classic textbook experiments have proven difficult to replicate, and publication bias – whereby positive findings are more likely to be published and negative findings to be dismissed – plagues the field.

Given this, scientists are exploring how to improve the way we conduct research and thereby improve the quality of what we produce. One suggestion is to preregister our research question, methods and analysis plan in advance of data collection. It is hoped that public preregistration will limit analytical flexibility and post hoc hypothesising, thereby improving the transparency and robustness of research findings.

Curious about the benefits of preregistration, and to see how it differed from the way I’d previously conducted my research, my colleagues and I published a preregistration for a recent study on Open Science Framework (OSF). We were interested in whether Cognitive Bias Modification, a psychological intervention designed to shift the emotional interpretation of faces, would impact clinically-relevant outcomes. We also entered the study into OSF’s (ongoing!) Preregistration Challenge, which offers the chance to win a $1,000 prize to 1,000 researchers who go from preregistration to publication.

Preregistering our study did require a greater time commitment prior to running it, but thinking about our predictions, design, and analyses meant that we could spot any potential issues and improve our experimental design before we collected data (i.e., before it was too late!). As a preregistration is public and cannot be changed after it’s published, it forced us to think more carefully about our decisions. For example, thinking more carefully about whether our data would truly answer our question made us wonder whether the emotional biases we wanted to study might be more prominent when an individual is under stress, so we decided to include another task to measure this. Also, by knowing which statistical analyses we would conduct before recruiting participants we could ensure that our study was adequately powered and would meet the assumptions of the planned analyses.

Initially I was concerned that this approach could be limiting. What if we found something interesting that we hadn’t expected and wanted to run additional analyses to probe it? But a preregistered report doesn’t prevent that – it simply means that you would (honestly and transparently!) report those analyses as exploratory. This protection against HARKing (hypothesising after the results are known) is important; separating analyses as planned versus exploratory can prevent overconfidence in weaker findings and the publication of attractive, but uncertain, positive findings.

Following data collection, we went back to our preregistration. It was here that our earlier time investment paid off; once our data were cleaned we could immediately run our planned analyses, and much of the manuscript writing (introduction and methods) was already done. We also ran a number of exploratory analyses, such as whether our results were moderated by participants’ anxiety scores. We subsequently published our findings in the academic journal Royal Society Open Science, and were thrilled to receive one of the latest $1,000 Preregistration Challenge prizes for bringing our study from preregistration to publication!

While interpreting findings and making discoveries is an important aim of scientific research, it is just as important to continuously scrutinise the scientific method. As a scientist, there is no question that seeing data can influence my decisions and interpretations. However, the adoption of preregistration can eliminate this, make the process easier in the long term, and improve research quality overall.

Professor Nosek and other members of the Reproducibility Project argue that, “Progress in science is marked by reducing uncertainty about nature”. But, if scientific findings have not or cannot be replicated, we can’t be certain that they exist. Preregistration is a simple change to the way we do research that can help to halt the reproducibility crisis and produce effective and credible science.

Read more about how to take part in the Preregistration Challenge here.

See Peters et al.’s preregistration here, and the published study here.

Sarah Peters can be contacted via email at: s.peters@bristol.ac.uk.

A Summary of the E-cigarettes Summit 2016

by Jasmine Khouja @jasmine_khouja

On the 17th November I attended the E-cigarette Summit 2016 at the Royal Society in London. The summit brought together researchers, policy-makers, smoking cessation services and industry members to hear about the latest research, developments and challenges in the e-cigarette domain.

The summit was a one-day event packed full of information with 20 fast-paced (10-20 minutes) talks and 4 panel discussions. My five take home points from the summit were:

  1. Communication

One point which was raised on multiple occasions was that good communication of the research into e-cigarettes is key to the public understanding the risks and benefits of e-cigarette use. Unfortunately, the consensus was that the communication of e-cigarette research to the public is poor. Astonishingly, one speaker commented that someone had asked their daughter: “Is your dad still selling e-cigarettes and killing people?” This demonstrates how badly e-cigarettes have been portrayed, despite general consensus that they are much less harmful than cigarettes. Researchers are trying to communicate their research but face hurdles; some journals may be less likely to publish articles that are positive about vaping, meaning that it is harder to publish evidence that vaping is not as bad for you as cigarettes. The media are also hampering researchers’ efforts as they prefer stories which are anti-vaping and sometimes draw inaccurate conclusions from the evidence, which makes for more interesting stories. However, effective communication of the research is possible: Professor Peter Hajek and Dr Alex Freeman provided some useful advice to researchers which included not inferring human risks from animal studies, ensuring risks are directly compared to those of smoking, being a trustworthy source by being competent, honest and reliable, and providing neutral information without recommendations allowing the public to make their own informed decisions.

  1. The British Medical Association’s Guidelines

Communication of the benefits and risks of e-cigarettes isn’t limited to publications and the media; doctors are being asked about e-cigarettes by patients. Despite the evidence that the research community has provided that e-cigarettes are less harmful than cigarettes, the British Medical Association are yet to update their guidelines to encourage smokers to switch to e-cigarettes. There seemed to be apprehension stemming from the lack of known long-term effects, despite the fact that we know there are vastly fewer and reduced amounts of toxicants in e-cigarettes compared to cigarettes meaning the likelihood of long-term effects as bad as or worse than smoking are extremely unlikely.

  1. Recent Research

Many new studies were presented but the study that really caught my attention was discussed by Dr Lynne Dawkins. Lynne provided evidence for increased puffing behavior when participants are given lower doses of nicotine in their e-cigarettes [1]. She concluded that inhaling more vapour to receive the same amount of nicotine exposes vapers to unnecessary amounts of toxicants. This is very topical as the regulations set out by the Tobacco Products Directive (TPD) which will be fully implemented by May 2017 limit doses to 20 mg/mL meaning that some higher dosage (36 mg/mL) users may expose themselves to extra toxicants to receive the levels of nicotine they need when the higher dosage product become unavailable in the next six months.

  1. The Tobacco Products Directive

The TPD provides some form of regulation for e-cigarette manufacturers and distributors. The inclusion of e-cigarettes in the TPD was controversial due to e-cigarettes not containing tobacco and the restrictive nature of the regulations which were seen as unnecessary by some users and industry members. Part of the regulations included the thorough testing of e-cigarette products to ensure they were safe and the publication of the contents (including toxicants) so that the public could make informed decisions. To my dismay, I was informed that the information submitted by the e-cigarette companies so far will not be made publically accessible for roughly six months due to a system error. I was also informed that compliance with the regulations was low and that age of sale restrictions in particular did not seem to be being enforced. The system and enforcement of the TPD in relation to e-cigarettes needs improving so that consumers can access the information which the TPD states they should have access to and to protect young people whose brain development may be adversely affected by consuming nicotine.

  1. New Systems

As restrictive as the TPD is, new products are still being developed. A new type of e-cigarette is emerging onto the market called pods. These devices are small and similar in size to older less effective designs of e-cigarettes (cigalikes) but have the power and nicotine delivery of the newer more effective tank systems. The sleek, compact designs combined with the improved nicotine delivery systems which prevent overheating (which is associated with harmful byproducts such as formaldehyde) are likely to be very popular. These systems can also record information on how the devices are used (how long individuals puff for and how many puffs they take etc.) which could provide essential information to researchers on how e-cigarettes are used in real life situations.

The day culminated in a key note speech by the Attorney General for Iowa, Tom Miller. He commended the UK’s focus on e-cigarette research and the general positive stance our public health officials have taken in terms of e-cigarettes. He concluded his speech by asking for help from the UK to bring the US up to the same standards.

References

  1. PMID: 27650300

Alcohol brief interventions: how can content, provider and setting reduce alcohol consumption?

screen-shot-2016-09-23-at-10-11-24 

Alcohol brief interventions (ABIs) provide structured advice on alcohol use. They involve an assessment of individual risk with feedback and advice, brief motivational interviewing, or a combination of these techniques.

While the Government’s Alcohol Strategy (HM Government, 2012) recommends that ABIs be implemented increasingly inprimary care settings and accident and emergency (A&E) departments, the National Institute for Health and Care Excellence (NICE) calls for alcohol brief interventions to be offered by a range of practitioners and in a range of different settings.

Given national-level support for increasing and wider use of ABIs, this systematic review and multi-level meta-regression by Platt and colleagues assessed the effectiveness of ABIs on alcohol consumption and how effectiveness of ABIs differs by:

  1. Content of intervention,
  2. Provider group and
  3. Setting.
Alcohol brief interventions usually involve a combination of risk assessment, feedback, advice and brief motivational interviewing.

Alcohol brief interventions usually involve a combination of risk assessment, feedback, advice and brief motivational interviewing.

Methods

Studies were peer-reviewed randomised controlled trials (RCTs) where participants were randomly allocated to a control group (such as treatment as usual) or a group which received an alcohol brief intervention.

Brief interventions were defined as person-to-person discussions on alcohol, with between 1 and 4 sessions and a total of 2 hours intervention time. ABIs which were delivered in groups or via a computer were excluded as were those which included participants with complex health problems where it is difficult to generalise findings to the general population.

The primary outcome measure was a quantitative continuous measure of total alcohol consumption, reported as the standardised mean difference between ABI group and control group measured at follow-up. The authors also examined how ABIs influenced the frequency of alcohol consumption.

Different types of setting, provider and content were examined and these are shown (along with the number of studies in each category) in the Results section below.

A multi-level meta-analysis method was used, which allowed the authors to include a number of different effect sizes from individual studies (i.e. amount of alcohol consumed per unit of time and/or amount of alcohol consumed per drinking occasion) rather than just trying to selecting one comparable effect size for each study).

Results

Study characteristics

50 studies were included in the analyses, with 29,891 individuals contributing data. 45% of studies were conducted in the USA and 22% in the UK.

The percentage of studies which examined alcohol brief interventions with different types of content, providers and settings are shown below:

Intervention content:

  1. Motivational interviewing (MI) (48%)
  2. Enhanced motivational interviewing (MI+) (40%)
  3. Brief advice approaches (24%)

Intervention providers:

  1. Counselors (44%)
  2. General practitioners (22%)
  3. Nurses (18%)
  4. Different providers (12%)
  5. Peer-delivered (4%)

Setting of intervention delivery:

  1. Primary or ambulatory care in clinical settings such as outpatient services (38%)
  2. A&E services (20%)
  3. University (20%)
  4. Community-based delivery (12%)
  5. Hospital inpatient services (10%)

Quality of the evidence

71% of studies were classified as having a low risk of bias regarding randomisation and allocation concealment strategies. However, the method of allocation concealment was unclear in most of the studies. An intention-to-treat analysis was conducted in 47% of the studies and loss to follow-up was assessed in 80% of studies.

The overall impact of ABIs as compared with control conditions

ABIs reduced alcohol consumption by -0.15 SDs (95% confidence interval (CI) = -0.20 to -0.10) a result the authors describe as a ‘small but statistically significant effect’. However, the extent to which this is clinically meaningful is less clear.

Note: The authors present the effect sizes as SDs because they have summarised their data as standardised mean differences. This method is used when included studies all assess the same outcome, but measure it in a variety of ways. Although this makes sense statistically, it does make understanding how important these effects are clinically a little more difficult.

The authors found that this effect persisted after controlling for covariates and when conducting sensitivity analyses. The studies included in this analysis were found to have a small to medium level of heterogeneity (I2 = 37%; this figure is the percentage of variation between trials which is due to actual variation between studies as opposed to variation due to chance. A small I2 value means that the majority of the differences observed between studies was due to chance).

ABIs reduced frequency of alcohol consumed by a similar amount (-0.15 SDs, 95% CI = -0.20 to -0.11).

Content

Splitting studies by ABI content didn’t reduce the heterogeneity between studies (I2 = 39%: no, or little change in this I2 value from when all studies are considered together (I2 = 37%) indicates that this categorisation by content does not adequately explain the heterogeneity between studies).

However, it did appear that all content types were effective at reducing amount of alcohol consumed, and there was some evidence that while brief advice is more effective than MI or MI+ for amount of alcohol consumed, brief advice did not appear to reduce the frequency of consumption while MI and MI+ did.

Providers

Splitting studies by ABI provider was not found to reduce the heterogeneity between studies (I2 = 34%).

ABIs delivered by a range of different providers or by peers were not found to be effective at reducing amount consumed or frequency of consumption (although it’s important to note that very few studies were included in these categories).

There was evidence that interventions delivered by counselors, physicians and nurses were effective, with those delivered by nurses the most effective (-0.23 SDs amount consumed, 95% CI = -0.33 to -0.13).

Setting

Splitting studies by ABI setting didn’t reduce the heterogeneity between studies (I2 = 34%).

There was no evidence that ABIs delivered in hospital inpatient services and in community settings were effective in reducing either amount or frequency of alcohol consumed.

Interventions delivered in A&E, ambulatory care settings and in universities were found to reduce alcohol both amount and frequency of alcohol consumed.

This review suggests that alcohol brief interventions have a ‘small but statistically significant effect’, but it's unclear whether or not this is clinically meaningful.

This review suggests that alcohol brief interventions have a ‘small but statistically significant effect’, but it’s unclear whether or not this is clinically meaningful.

Conclusions

The authors conclude that their study provides:

important new evidence on how the effectiveness of brief alcohol interventions differs by setting, provider and content.

While this analysis does show that ABIs reduce amount of alcohol consumed and frequency of consumption, the size of this effect is small. It will be important to determine to what extent this is a clinically meaningful effect.

Although the authors claim that their findings suggest that the “provider of interventions may matter” (with nurses providing the best results) there is only weak evidence for this. As the categorisation of studies by provider (and setting and content for that matter) didn’t really have any impact on the heterogeneity (as measured by I2) between studies, there is little evidence that the effectiveness of ABIs differed meaningfully across providers.

Interventions delivered by nurses appeared the most effective, although further work is needed to confirm this finding.

Interventions delivered by nurses appeared the most effective, although further work is needed to confirm this finding.

Strengths and limitations

Strengths

As the authors used a multi-level meta-analysis, they were able to include all relevant outcomes into their analysis, rather than just picking one outcome (and consequently having to exclude studies which did not assess this outcome). This is also likely to have reduced study level heterogeneity.

Limitations

As the authors were interested in the difference in effectiveness of a range of different ABI settings, providers and contents, the number of studies included within each of these categories was small. This makes drawing firm conclusions regarding the effectiveness of particular forms of ABIs difficult.

Implications

Given that there is little evidence to suggest that the effectiveness of alcohol brief interventions differs meaningfully according to setting, provider or content, the authors do note that this indicates that resources should be allocated to those settings, providers and contents where ABIs are likely to be most cost-effective and feasible.

For example, A&E may not be the best setting for ABIs given the lack of privacy, the brevity of the visit and the fact that the patient is likely to be suffering from a severe injury at the time.

Nurses are likely to be well placed to provide ABIs given their repeated contact with patients, although appropriate training should be provided to nurses so that they can embed these practices into their care.

Focusing on interventions that are feasible and cost-effective seems like the biggest practical advice from this evidence.

Focusing on interventions that are feasible and cost-effective seems like the biggest practical advice from this evidence.

Links

Primary paper

Platt L, Melendez-Torres GJ, O’Donnell A, Bradley J, Newbury-Birch D, Kaner E, et al. (2016) How effective are brief interventions in reducing alcohol consumption: do the setting, practitioner group and content matter? Findings from a systematic review and metaregression analysis. BMJ Open. 2016;6(8).

Other references

HM Government (2012) The Government’s Alcohol Strategy PDF. CM 8336, March 2012.

Photo credits

Teaming up to improve the Psychology PhD

by David Troy @DavidTroy79 and Jim Lumsden @jl9937

Human beings are social creatures; we evolved to work together. Our education system is built around this fact; and throughout school and university we encourage students to team up to solve problems, discuss concepts and answer questions. At the same time, as science advances into the 21st century, we find ourselves trying to answer increasingly difficult questions. These new problems cannot be effectively addressed by one person working alone, and academia and industry are increasingly embracing ‘Team Science’, with many articles ssbeing authored by large groups of individuals with a range of specialisms. As experts in disparate fields, these scientists combine their strengths to triangulate evidence and build robust theories. However, in our experience, the field of experimental psychology has yet to adapt to this model of working, and we suspect this has its root at the very beginning of a psychologist’s career: the solo nature of the psychology PhD. This final stage of training to be a scientist consists of a 3-4 year long solo project which, by its very nature, does not foster close collaboration between researchers. A PhD is a course in independent working – it might teach determination, motivation and self-confidence, but it does not teach teamwork. We believe this needs to change.

A new model:

We would like to see a new model of PhD, based on the kind of team environment found in the software development world. Under this model, a research group would be subdivided into several small teams of scientists, with perhaps 3 or 4 PhD students and a postdoc working very closely together. The group would be located in the same office and tackle research questions collaboratively. Overall supervision would come from multiple senior academics, but the post-doc would act as team-leader on a day-to-day basis. Other stakeholders such as clinicians, policy makers and industry-partners may be invited to work within the group to improve the translatability and relevance of the research.

The main purpose of a team-PhD would be to work towards publishable projects much like a conventional company works towards product release deassssdlines or software updates. However, this increased emphasis on publications should not come at the cost of rigour and integrity with the primary focus remaining the adequate training of the candidate in scientific best practice during their PhD. By pooling resources and effort, such a team would be able to tackle the questions addressed by a traditional PhD thesis in less time. Joint 1st authorships would be common, with each team member’s contribution made explicit, rather than recognised implicitly via authorship order. A common theme of research chosen by team members (with direction from the post-doc team leader and supervisors) would be apparent from the team’s output over several years, but the studies and directions chosen should not need to be as cohesive as a traditional PhD. Given that a PhD is supposed to be training there is currently far too much focus on producing a coherent output (the “narrative arc”), rather than developing essential skills (not intending to diminish the important skill of clear, concise scientific writing). We are scientists, not novelists, and should be free to move around various fields to where our skills are needed most.

Let’s imagine a typical working day: You’re busy handling the response letter to the reviewers of your team’s latest paper. Every now and again you turn around to ask your teammates “How should we handle this question? Should we run some extra analysis?”. Your colleague beside you is writing the protocol for your group’s next project. She’s writing in Google Docs, so any member of the team can chip in whenever they want to. The experiment is designed collaboratively, and you will collect the data together. When the data are in, two team members handle the analysis, while the others write the introduction and methods. The team leader allocates different roles on each project, so you’re always learning new skills, but never far from help. Each day starts with a 10-minute meeting, discussing the plan for the day and flagging up any new papers that people have read and any good ideas that have arisen in the last 24 hours.

We believe that working together in a small group would bring many benefits: individuals can read papers and report back summarised findings, they can discuss theories, bounce ideas off each other, cross-check analysis and spot mistakes. Together they can run larger samples, read more widely, attempt more complex analyses, discuss more deeply, and so on. This sort of introspection and group effort leads to rigour, improved quality control, and ultimately higher throughput. Working in a team in this way would be motivating, with more camaraderie and positive peer-pressure, compared to the current PhD experience. Expertise would be shared between team members with the end result being a team of researchers competent in essential scientific skills (e.g., programming, statistics, study design, etc.). A team-PhD would also help to combat the isolation so many postgraduate students feel.

In order to accommodate this change to the nature of the PhD, the existing application process, whereby the candidate prepares a research proposal describing their own project, would need to be replaced with a more general application in which the applicant describes their research skills, areas of interest and motivations for long-term study. Successful applicants would be added to the research team most in need of their skillset: if a team is already strong in statistical methods then perhaps a psychologist could add a new perspective, for example.

A change in the PhD structure would also require a change to the assessment process. It is often said that PhD theses ends up in university libraries, never to be read again. Given that PhDs are often publically funded, the time spent altering a publication to fit the narrative arc of a thesis would be better spent dedicated to science that can have tangible impact. University of Bristol, alongside other universities, offers an alternative, if rarely used, PhD by published work. In this format candidates do not submit a thesis, but rather must publish a series of “coherent” works, alongside a commentary on the general direction of their research, its scope and aims. Currently, it takes ~10 years to amass enough publications to qualify for this route; however, it is plausible to alter this to the timeframe of a normal PhD. This format of PhD is more likely to produce high quality scientific output, published in academic journals, rather than rotting on a library shelf. Additionally, a PhD-by-publication still requires an oral examination. This exam would be used to ensure that team-PhD candidates are still capable, independent scientists with a sound understanding of their field, even though the bulk of their research was conducted as part of a team.

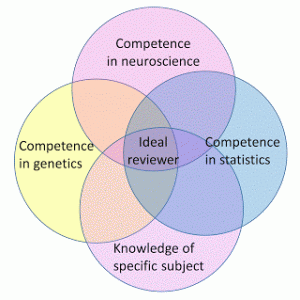
The teaming up of researchers with different competencies working on publications may have unintended consequences. It may be difficult to find one person to adequately review such work as is currently the case in neurogenetics for example. A possible remedy would be to restructure the review process to include teams of reviewers, where each member of the team specialises in addressing one of the specialisms described in the paper.ssssssssss

So, how can we move from solo training to team-based training? We suggest it is possible to trial the addition of team science to the PhD process by mandating that new PhD candidates work in a team, as part of their 1st year of study. In recent years, the 1+3 year PhD has become more common, whereby candidates carry out solo mini-projects in their 1st year to acquire experience and training in disparate fields. This could be altered to incorporate close teamwork in the execution of these mini-projects. This would provide an opportunity to examine the everyday benefits and challenges of this new mode of working. This way, students would not be overly disadvantaged when emerging from their PhD into a world of academia still concentrated around the principal investigator model, as the majority of their training would still be focused on generating and implementing their own ideas and developing their own “brand” or intellectual identity as a scientist.

Conclusion

The current model of attaining a PhD in psychology is too focused on solo work. We argue that introducing a more collaborative and cohesive framework to the PhD would aid in the development of research skills and produce more well-rounded PhD graduates equipped to tackle complex research questions. We hope this blog post will spark debate about the suitability of current training for psychological research and generate further ideas on how it can be improved to produce researchers with the skillset necessary for science in the 21st century.


Photo credits:

  1. http://dk.hjernekraft.org/turnering/279/lillestrom/lag.aspx?id=5602
  2. https://fbs.admin.utah.edu/research-corner/2015/07/28/enhancing-the-effectiveness-of-team-science/
  3. http://deevybee.blogspot.co.uk/2016/10/on-incomprehensibility-of-much.html

Institutional smoking bans reduce secondhand smoke exposure and harms, but more research is needed

10213459946_055cecb282_k

It’s been almost 9 years since the introduction of SmokeFree legislation in the UK (although we elves still return from a night out smelling of campfire smoke). However, secondhand smoke is still accountable for 600,000 deaths annually.

Smoke free policies can be implemented at the micro-level (i.e. the individual level or in homes), the meso-level (i.e. in organisations, such as public healthcare facilities, higher education centres and prisons) or the macro-level (i.e. in an entire country). In many countries, smokefree legislation is at the macro-level, although exemptions exist at the meso-level. For example, in the UK, specific rooms in prisons and care homes are exempt from this legislation.

In their Cochrane review, Frazer and colleagues review the evidence for meso-level smoking bans (in venues not typically included in smokefree legislation) on 1) passive smoke exposure, 2) other health-related outcomes and 3) active smoking, including tobacco consumption and smoking prevalence.

Worldwide, secondhand smoke is still accountable for 600,000 deaths annually.

Worldwide, secondhand smoke is still accountable for 600,000 deaths annually.

Methods

Identification of included studies

The authors searched online databases of clinical trials, reference lists of identified studies and contacted authors to identify ongoing studies. Studies were included if they:

The introduction of smoking bans in psychiatric hospitals and prisons is extremely controversial.

The introduction of smoking bans in psychiatric hospitals and prisons is extremely controversial.

Results

Characteristics of included studies

No randomised controlled trials (RCTs) were found. 17 observational studies were identified (three using a controlled before-and-after design with another site for comparison and 14 using an uncontrolled before-and-after design). Of these 17 studies:

  • 12 were based in hospitals;
  • 3 in prisons;
  • 2 in universities.

Five studies investigated the impact of smoking bans on two participant groups (i.e. staff and either patients or prisoners).

The 17 studies were conducted in 8 countries: the USA (6 studies), Spain (3 studies), Switzerland (3 studies), Australia, Canada, Croatia, Ireland and Japan (all 1 study). Eight of these were conducted in US states or countries with macro-level (i.e. national) smoke-free legislation, eight with no legislative bans and one which compared all 50 US states (some with national bans and others without).

Main findings

There was considerable heterogeneity between the 17 studies and so a meta-analysis of all studies was not conducted. Instead studies were analysed using aqualitative narrative synthesis according to each of the outcome measures:

Reducing secondhand smoke exposure

Four studies assessed secondhand smoke exposure, finding that a reduction in exposure was observed in all three settings after smoking bans. However, none of the studies in the review used a biochemically validated measure of smoke exposure such as cotinine or carbon monoxide levels.

Other health outcomes

Four studies examined the impact of partial or complete smoking bans on health outcomes including smoking-related mortality. Two were conducted in prisons, one in a hospital and one in a secure mental hospital (Etter et al, 2007). All of these studies observed improvements in smoking-related morbidity and mortality after smoking bans. One of these assessed the impact of smoking bans in prisons in all 50 US states and found that smoking-related mortality was reduced in those prisons that had a smoking ban for more than 9 years.

Tobacco consumption and smoking prevalence

Thirteen studies reported data on the effect of smoking bans on smoking prevalence and five of these reported data on two populations within settings (i.e. prisoners and prison staff).

Eleven of these studies were included in a meta-analysis (using the Mantel-Haenszel fixed-effect method) and the data from the 12,485 participants in these studies was pooled. Although there was considerable heterogeneity between these studies (I2 = 72%; where a higher I2 value is evidence of higher levels of heterogeneity), this heterogeneity was lower within subgroups (e.g. in prisoners or hospital staff).

Ten studies conducted in hospital settings found mixed evidence for the impact of smoking bans on smoking prevalence. Eight of these studies were included in the meta-analysis and there was evidence that smoking bans reduced active smoking rates among hospital staff (risk ratio (RR) 0.71, 95% confidence interval (CI) 0.64 to 0.78, n = 4,544, I2 = 76%) and patients (RR 0.84, CI 0.76 to 0.98, n = 1442, I2 = 20%).

The one study in a prison setting found no evidence of a change in smoking prevalence among staff or prisoners after a smoking ban (RR 0.99, CI 0.84 to 1.16, n = 130).

Two studies in university settings observed reductions in smoking prevalence after smoking bans (RR 0.72, CI 0.64 to 0.80, n = 6,369, I2 = 59%), although one study only observed this among male ‘frequent’ smokers.

Quality of the evidence

The evidence was judged to be of low quality as all of the studies wereobservational (none used a RCT design) and the risk of bias was rated as high.

Banning smoking in hospitals and universities increased the number of smoking quit attempts and reduced the number of people smoking.

Banning smoking in hospitals and universities increased the number of smoking quit attempts and reduced the number of people smoking.

Conclusion

Overall, this review finds evidence of smoking bans on:

  • reducing smoking prevalence in hospitals and universities, with the greatest reductions among hospital staff;
  • reduced mortality and exposure to secondhand smoke in hospitals, universities and prisons.

Limitations

The quality of the evidence was low and the authors conclude that ‘we therefore need more robust studies assessing evidence for smoking bans and policies in these important specialist settings’. Limitations with the studies included in the review include: small sample sizes in some studies, a lack of a control location for comparison in all but three studies and a high level of heterogeneity between and within the different settings (e.g. the hospital settings included a cancer hospital, psychiatric hospitals and general hospitals).

We need more robust studies assessing the evidence for smoking bans and policies in specialist settings.

We need more robust studies assessing the evidence for smoking bans and policies in specialist settings.

Discussion

The authors report that given this evidence, smoking bans at the meso-level should be considered as part of multifactorial tobacco control activities to reduce secondhand smoke exposure and smoking prevalence.

Given that the introduction of these bans particularly in psychiatric hospitals and prisons is controversial, the introduction of these bans should be sensitive to the needs of populations. For example, bans in psychiatric hospitals should be implemented in consultation with psychiatrists to ensure that the improved health outcomes of patients is considered first and foremost. As the evidence is currently weak, with a high risk of bias, any interventions should be closely monitored.

More robust studies are needed, using a control group for comparison, assessing smoke exposure using biochemically validated measures, using long-term follow-ups of at least 6 months and reporting smoking prevalence both before and after the introduction of the ban.

It is not possible to draw firm conclusions about institutional smoking bans from the current evidence.

It is not possible to draw firm conclusions about institutional smoking bans from the current evidence.

Links

Primary paper

Frazer K, McHugh J, Callinan JE, Kelleher C. (2016) Impact of institutional smoking bans on reducing harms and secondhand smoke exposure. Cochrane Database of Systematic Reviews 2016, Issue 5. Art. No.: CD011856. DOI: 10.1002/14651858.CD011856.pub2.

Other references

Etter M, Etter JF. (2007) Acceptability and impact of a partial smoking ban in a psychiatric hospital.. Preventive Medicine 2007;44(1):649. [PubMed abstract]

Photo credits

From number crunching to brains: my experiences of interdisciplinary research

by Michelle Taylor @chelle_bluebird

From TARG to neuroscience

The final six months of a PhD can be a stressful time. Not only are you trying to write up three years of research, wondering whether you have done enough work, but you also need to consider what to do next. I decided to try my hand at something different…

eeg1

My PhD was in the area of epidemiology, where I was using large datasets (such as the Avon Longitudinal Study of Parents and Children, based here at the University of Bristol) to determine causes and consequences of using various drugs of abuse. My time was mainly spent designing and conducting statistical analyses on data that had already been collected and were available for secondary analysis. I completed this work in TARG and the School of Social and Community Medicine and was lucky enough to be funded by the Wellcome Trust on a PhD programme in molecular, genetic and lifecourse epidemiology. The Wellcome Trust also fund two other PhD programmes at the University of Bristol, one in ‘Neural Dynamics’ and another in ‘Dynamic Cell Biology’. Towards the end of my PhD an opportunity arose – the Elizabeth Blackwell Institute were offering three researchers fellowships to conduct nine months of research with one of the other Wellcome Trust programmes. This would involve changing research area and learning something completely new – and I decided to go for it. I applied to move to the Neural Dynamics programme. As my past research had focused on addiction and mental health, gaining knowledge of the field of neuroscience seemed fitting.

eeg2

After identifying a potential new supervisor and quickly putting together and submitting an application I was told that I had been successful. I was go
ing to become a neuroscientist for the next nine months. The day after handing in my PhD I headed off to the lab of Matt Jones, a neuroscientist whose research interests include sleep, memory and brain circuitry. I was going to be working on a study that aimed to find out more about how genes influence overnight brain activity and memory in humans. I’ve written a little more about this study at the end of this blog post, just in case you’re interested!

My new lab group were very friendly and welcoming, although at times it seemed like they were talking in a different language. I would attend seminars in my new department and be completely confused within minutes. While I did have some knowledge of neuroscience from reading literature, my knowledge was severely lacking compared to that of my new colleagues. Mind you, I could always get my own back by blinding them with statistics!


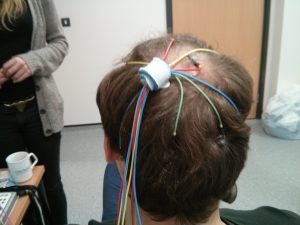
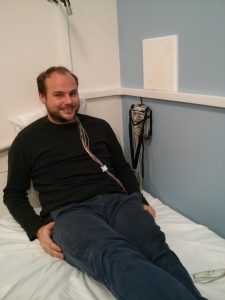
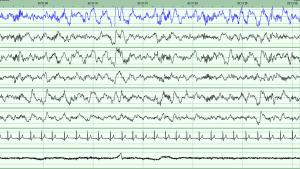
The study involved getting participants to stay in our sleep clinic overnight and measuring their brain activity while they slept. I had to learn new methods of data collection, which involved measuring a person’s head to find specific points and gluing on electrodes to measure their brain activity (known as PSG, or polysomnography) [1]. Once these data were collected, the night’s recording needed to be scored into various stages of sleep. We can determine this from the length, height and frequency of the waves on the sleep recording. There are two main stages of sleep: REM (which stands for rapid eye movement) and non-REM. Non-REM can be broken down further into stages 1, 2 and 3 [2,3]. Stage 3 is the deepest stage of sleep, while stage 2 contains oscillations called spindles and K-complexes which are thought to play a role in memory consolidation while we sleep [3]. Learning to score a night’s sleep was something very new to me. I was used to having my data in the form of numbers in a spreadsheet not as wavy lines dominating the computer screen!

brain_activity

At the end of the nine months, I found myself understanding the talks that I went to – I even started to sound like a neuroscientist myself at times. Many things which originally seemed overwhelming (such as collecting PSG data) now feel like second nature, and the wavy lines on a computer screen are now meaningful. While at first the experience seemed daunting, it has no doubt opened my mind and expanded my knowledge. The ability to conduct interdisciplinary research is a well-regarded asset, but this experience has not only enhanced my CV. It has increased my confidence when talking to other researchers, as I have realised that we can all learn something from one another. Most importantly I have learned to look at research from a broader perspective – what does my research mean for other fields? How can it inform other research that is different from my own? It is, of course, combining the answers to all of these questions that will enhance science and in turn have more impact on the wider world.

My neuroscience experience has come to an end and for now, it is back to epidemiology. But I will definitely look back on my time in neuroscience fondly, and, who knows, I might even get the chance to integrate epidemiological research with neuroscience in the future…


A little more about the study

Different parts of our brains communicate with one another as we learn new information during the day. Overnight brain activity then helps us to file memories for long-term storage. Evidence suggests that this process varies naturally in everyone. To help us understand what causes this variation, we are interested in finding out more about how genes influence overnight brain activity in healthy individuals. Studying our genes by specifically testing those who carry particular (naturally occurring) form of them can help us understand their role in shaping the natural variation we see in brain activity. Importantly, understanding this in healthy people can then go on to help us develop new targets for treatments to help the sick. We therefore carried out a study to look at how naturally occurring variation at a particular gene variant affects memory consolidation during sleep.

The gene variant was chosen based on previous studies that have shown that it affects both brain activity and sleep. To do this, we invited back participants from the Avon Longitudinal Study of Parents and Children who had provided us with a DNA sample. Information about their genes had been processed and based on this information they were identified as being carriers or non-carriers of the gene we were interested in. This is a study design known as ‘recall-by-genotype’. We then asked these people to spend two nights in a sleep laboratory, perform some memory based tasks and complete some questionnaires so that we can measure how genetic differences relate to memory and brain activity during sleep.

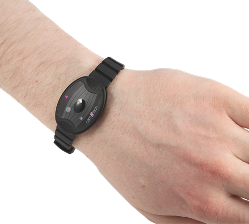
motionwatch_wrist_smlWhilst participants were in the sleep facility we attached a number of sensors to their head in order to record their brain waves, eye movements and muscle activity. We also used sensors on the chest to measure heart rate and take video and audio recordings to confirm whether or not participants become unsettled during the night. Participants were asked to complete some questionnaires about their sleep behaviour and to carry out a memory task before and after sleep.

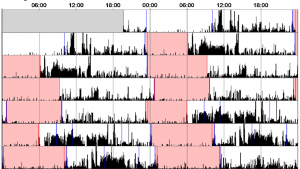
For the two weeks in between visits to the sleep laboratory, we asked participants to wear an ‘actiwatch’. An actiwatch looks like a normal watch and records movement, telling us when the participant usually goes to sleep and wakes up. We asked participants to wear the actiwatch on their wrist at all times and asked them to fill in a sleep diary for the two weeks.

What do we hope to find?

actigraphyWe hope to find that individuals who carry our genetic variant of interest differ from those who do not carry the variant on a range of sleep characteristics including the non-REM stage 2 spindles and slow wave oscillations found on stage 3 of non-REM sleep. We also expect to find difference between genotype groups on ability to complete the memory task, and the speed at which they complete the memory task. Finally, we expect to observe a correlation between the stage 2 sleep spindles and the results of the memory task. If we observe these results in our data, then this will suggest that this genotype can influence brain activity during sleep which then in turn can effect a person’s memory, as this memory is not being consolidated as well over night.


Where can I find out more?

A protocol for this study has already been published [4].
Once completed, this study will be published open access within a scientific journal.

References:

[1] Wikipedia – polysomnography

[2] American association of sleep

[3] Wikipedia – sleep (including information on stages, spindles, K-complexes and slow waves)

[4] Hellmich C, Durant C, Jones MW, Timpson NJ, Bartsch U, Corbin LJ (2015) Genetics, sleep and memory: a recall-by-genotype study of ZNF804A variants and sleep neurophysiology. BMC Med Genet 16:96

Psychiatric disorders: what’s the significance of non-random mating?

7960674098_2070f1fe64_bHardly a week passes without the publication of a study reporting the identification of genetic variants associated with an increasing number of behavioural and psychiatric outcomes. This partly driven by the growth in large international consortia of studies, as well as the release of data from very large studies such as UK Biobank. These consortia and large individual studies are now achieving the necessary sample sizes to detect the very small effects associated with common genetic variants,.

We’ve known for some time that psychiatric disorders are under a degree of genetic influence, but one puzzle is why estimates of the heritability of these disorders (i.e., the proportion of variability in risk of a disorder that is due to genetic variation) differs across disorders. Another intriguing question is why there appears to be a high degree of genetic comorbidity across different disorders; that is, common genetic influences that relate to more than one disorder. One possible answer to both questions may lie in the degree of non-random mating by disorder.

Non-random mating refers to the tendency for partners to be more similar than we would expect by chance on any given trait of interest. This is straightforward to see for traits such as height and weight, but less obvious for traits such as personality. A recent study by Nordsletten and colleagues investigated the degree of non-random mating for psychiatric disorders, as well as a selection of non-psychiatric disorders for comparison purposes.


Methods

The researchers used data from three Swedish national registers, using unique personal identification numbers assigned at birth. The data were linked to the Swedish National Patient Register (NPR), which includes diagnostic information on all individuals admitted to a Swedish hospital and, since 2001, on outpatient consultations. Individuals with multiple diagnoses could appear as a “case” in each separate analysis of these different diagnoses.

Cases of schizophrenia, bipolar disorder, autism spectrum disorder, anorexia nervosa, substance abuse, attention deficit hyperactivity disorder (ADHD), obsessive compulsive disorder (OCD), major depressive disorder, social phobia, agoraphobia, and generalised anxiety disorder were identified using standard protocols. For comparison purposes, cases of Crohn’s disease, type 1 and type 2 diabetes, multiple sclerosis and rheumatoid arthritis were also identified.

For each case (i.e., individuals with a diagnosis), five population controls were identified, matched on age, sex and area of residence. Mating relationships were identified through records of individual marriages, and through records of individuals being the biological parent of a child. The use of birth of a child was intended to capture couples who remained unmarried. For each member of a mated case pair a comparison sample was again generated, with the constraint that these controls not have the diagnosis of interest.

First, the proportion of mated pairs in the full case and control samples was summarised. Correlations were calculated to evaluate the relationship between the diagnostic status of each individual in a couple, first within and then across disorders. Logistic regression was used to estimate the odds of any diagnoses in mates of cases relative to mates of controls. Finally, the odds of any diagnosis in mates was estimated, and the relationship between the number of different disorders in a case and the presence of any psychiatric diagnoses in their mate explored.

Non-random mating is not a lack of promiscuity, it's the tendency for partners to be more similar than we would expect by chance on any given trait of interest.

Non-random mating is not a lack of promiscuity! It’s the tendency for partners to be more similar than we would expect by chance on any given trait of interest.

Results

Cases showed reduced odds of mating relative to controls, and this differed by diagnosis, with the greatest attenuation among individuals with schizophrenia. In the case of some diagnoses (e.g., ADHD) this low rate of mating may simply reflect, at least in part, the young age of these populations.

Within each diagnostic category, there was evidence of a correlation in diagnostic status for mates of both sexes (ranging from 0.11 to 0.48), and there was also evidence of cross-disorder correlations, although these were typically smaller than within-disorder correlations (ranging from 0.01 to 0.42).

In general, if an individual had a diagnosis this was typically associated with a 2- to 3-fold increase in the odds of his or her mate having the same or a different disorder. This was particularly pronounced for certain conditions, such as ADHD, autism spectrum disorder and schizophrenia.

In contract to psychiatric samples, mating rates were consistently high among both men and women with non-psychiatric diagnoses, and correlations both across and within the conditions was rare (ranging from -0.03 to 0.17), with the presence of a non-psychiatric diagnosis associated with little increase in his or her spouse’s risk.

This general population study found an amazing amount of assortative (non-random) mating within psychiatric disorders.

This general population study found an amazing amount of assortative mating within psychiatric disorders.

Conclusions

These results indicate a striking degree of non-random mating for psychiatric disorders, compared with minimal levels for non-psychiatric disorders.

Correlations between partners were:

  • Greater than 0.40 for ADHD, autism spectrum disorder and schizophrenia,
  • Followed by substance abuse (range 0.36 to 0.39),
  • And detectable but more modest for other disorders, such as affective disorders (range 0.14 to 0.19).

The authors conclude the following:

  • Non-random mating is common in people with a psychiatric diagnosis.
  • Non-random mating occurs both within and across psychiatric diagnoses.
  • There is substantial variation in patterns of non-random mating across diagnoses.
  • Non-random mating is not present to the same degree for non-psychiatric diagnoses.

Implications

So, what are the implications of these findings?

First, non-random mating could account for the relatively high heritability of psychiatric disorders, and also explain why some psychiatric disorders are more heritable then others (if the degree of assortment varies by disorder).

This is because non-random mating will serve to increase additive genetic variation across generations until equilibrium is reached, leading to increased (narrow sense) heritability for any trait on which it is acting.

Second, non-random mating across psychiatric disorders (reflected, for example in a correlation of 0.31 between schizophrenia and autism spectrum disorder) could help to explain in part the observed genetic comorbidity across these disorders.

Non-random mating could explain why some psychiatric disorders are more heritable then others.

Non-random mating could explain why some psychiatric disorders are more heritable than others.

Strengths and limitations

This is an extremely well-conducted, authoritative study using a very large and representative data set. The use of a comparison group of non-psychiatric diagnoses is also an important strength, which gives us insight into just how strong non-random mating with respect to psychiatric diagnoses is.

The major limitations include:

  • Not being able to capture other pairings (e.g., unmarried childless couples)
  • A reliance on register diagnoses, which largely excludes outpatients etc
  • A lack of insight into possible mechanisms

This last point is interesting; non-random mating such as that observed in this study could arise because couples become more similar over time after they have become a couple (e.g., due to their interactions with each other) or may be more similar from the outset (e.g., because similar individuals are more likely to form couples in the first place, known as assortative mating).

The authors conclude that the non-random mating they observed may be due toassortative mating for two reasons. First, shared environment (which would capture effects of partner interactions) appears to play very little role in many psychiatric conditions. Second, neurodevelopmental conditions are present over the lifespan (i.e., before couples typically meet), which would suggest an assortative mating explanation for the observed similarity for at least these conditions.

Some disorders (e.g., schizophrenia) are associated with reduced reproductive success, and therefore should be under strong negative selection in the general population. However, these results suggest they may be positively selected for within certain psychiatric populations. In other words, these mating patterns could, in part, compensate for the reduced reproductive success associated with certain diagnoses, and explain why they persist across generations.

Implications for future research

Non-random mating also has implications for research, and in particular the use of genetic models. These models typically assume that mating takes place at random, but the presence of non-random mating (as indicated by this study) suggests that this should be taken into account in these models. This could be done by allowing for a correlation between partners, and neglecting this correlation may lead to an underestimate of heritability.

Summary

This study suggests that non-random mating is widespread for psychiatric conditions, which may help to provide insights into why these conditions are transmitted across generations, and why there is such a strong degree of comorbidity across psychiatric diagnoses. The results also challenge a fundamental assumption of many genetic approaches.

Assortative mating means that the person closest to an individual with a psychiatric disorder is also likely to have psychiatric problems.

Assortative mating means that, in general population terms, people in romantic relationships with those who have psychiatric disorders are also likely to have psychiatric problems themselves.

Links

Primary paper

Nordsletten AE, Larsson H, Crowley JJ, Almqvist C, Lichtenstein P, Mataix-Cols D. (2016) Patterns of nonrandom mating within and across 11 major psychiatric disorders. JAMA Psychiatry 2016. doi: 10.1001/jamapsychiatry.2015.3192

Photo credits

Treatment for depression in traumatic brain injury: Cochrane find no evidence for non-pharmacological interventions

by Eleanor Kennedy @Nelllor_

This blog originally appeared on the Mental Elf site on 31st May 2016.

Traumatic Brain Injury has been associated with increased occurrence of depression (Gertler et al, 2015). Traumatic Brain Injury results from damage to the brain by external forces, such as direct impact or rapid acceleration; consequences of a traumatic brain injury may be temporary or permanent and can lead to problems with cognition, emotion and behaviour (Maas, Stocchetti, & Bullock, 2008).

The main feature of depression is either a depressed mood or loss of interest and pleasure in usual activities, or both, consistently for a two week period. Depression can present as a major risk factor for suicide after Traumatic Brain Injury.

A recent Cochrane systematic review aimed to measure “the effectiveness of non-pharmacological interventions for depression in adults and children with Traumatic Brain Injury at reducing the diagnosis and severity of symptoms of depression.”

People who experience traumatic brain injury are at an increased risk of depression.

People who experience traumatic brain injury are at an increased risk of depression.

Methods

The Cochrane Injuries Group searched eight electronic databases for randomised controlled trials (RCTs) of non-pharmacological interventions for depression in adults and children who had a Traumatic Brain Injury. For inclusion in the review, study participants had to fulfil the following criteria:

  • A history of Traumatic Brain Injury due to external forces; samples that included participants with non-traumatically acquired brain injury, such as stroke, were also included if the data allowed for separate analysis of those with Traumatic Brain Injury
  • Fulfilment of diagnostic criteria for an applicable mood disorder, such as major depressive disorder or adjustment disorder with depressive mood, based on DSM or ICD criteria
  • Presenting with clinically significant depressive symptoms based on standardised measures

The primary outcome was “the presence or remission of depressive disorders, as determined by the use of accepted diagnostic criteria (e.g. DSM-IV or ICD-10), by the use of a standardised structured interview based on such criteria (e.g. Structured Clinical Interview for the DSM Disorders), or the results of validated self- or observer-rated questionnaires of depressive symptoms.”

The secondary outcomes were:

  • Neuropsychological functioning, psychosocial adjustment, everyday functioning, quality of life, and participation
  • Medication and healthcare service usage
  • Treatment compliance, based on the proportion of withdrawals from intervention
  • The occurrence of suicide or self-harm
  • Any adverse effects of the intervention.

Results

Six studies were included in the review. Three of the studies were carried out in the USA (Ashman, Cantor, Tsaousides, Spielman, & Gordon, 2014; Ashman & Tsaousides, 2012; Fann et al., 2015; Hoffman et al., 2010), one in China (He, Yu, Yang, & Yang, 2004), one in Canada (Bedard et al., 2014) and one in Australia (Simpson, Tate, Whiting, & Cotter, 2011). Participants in all studies were over 18 years of age.

Summary of interventions in included studies

Study NParticipants Intervention Duration of Treatment Outcome measure
Ashman 2014 (Ashman et al., 2014; Ashman & Tsaousides, 2012) 77(43 completed) Cognitive Behaviour Therapy (CBT) or Supportive Psychotherapy (SPT) 16 sessions over 3 months Structured Clinical Interview for DSM-IVBeck Depression Inventory – second edition (BDI-II)
Bedard 2013 (Bedard et al., 2014) 105(76 completed) Mindfulness-based cognitive therapy (MBCT) modified to suit those with TBI 10 weekly session plus recommended daily meditation BDI-II
Fann 2015 (Fann et al., 2015) 100(86 with follow up data) CBT in person or by telephone 8 to 12 weekly sessions Hamilton Depression Rating Scale (HAMD-17)
He 2004 (He et al., 2004) 64(63 completed) Repetitive transcranial magnetic stimulation (rTMS) 4 treatment sessions each lasting 5 days, with an interval of 2 days between sessions HAMD
Hoffman 2010 (Hoffman et al., 2010) 80(76 completed) Supervised exercise training 10 weekly sessions, plus a home program BDI
Simpson 2011 (Simpson et al., 2011) 17(16 completed) Group-based CBT 10 weekly sessions Hospital Anxiety and Depression Scale (HADS)

Primary outcomes

The review reported on four comparative analyses:

  1. CBT, or a variant of CBT, vs waiting list; included a meta-analysis of three studies (Bedard, Fann, Simpson). There was no indication of a difference in depression symptoms attributable to the intervention (standardised mean difference (SMD) -0.14, 95% CI -0.47 to 0.19; Z = 0.83, p = .41).
  2. CBT to SPT; based on one study (Ashman), the difference in depression remission was not statistically supported (RR 0.76; 95% CI 0.58 to 1.00; Z = 1.96; P = 0.05) nor was the difference between groups in depression symptoms (SMD -0.09; 95% CI -0.65 to 0.48; Z = 0.30; P = 0.77).
  3. rTMS plus tricyclic antidepressants (TCA) to TCA; based on one study (He). There was a reduction in depression symptoms seen in the rTMS plus TCA group, (0.84; 95% CI -1.36 to -0.32; Z = 3.19; P = 0.001), however the difference was not considered to be clinically relevant. This was the only study to report adverse effects as two participants reported transient tinnitus with spontaneous remission.
  4. Supervised exercise and exercise as usual; based on a single study (Hoffman). There was no difference in depression symptoms between groups following the intervention (SMD -0.43; 95% CI -0.88 to 0.03; Z = 1.84; P = 0.07).

Secondary outcomes

Secondary outcomes were reported for each individual study. There was no difference in treatment compliance between intervention and comparison group in each study. One study (He et al., 2004) reported adverse effects as two participants reported transient tinnitus with spontaneous remission.

Most other secondary outcomes showed no difference between intervention and treatment groups.

There is insufficient evidence to recommend any particular non-pharmacological treatment for depression in traumatic brain injury.

There is insufficient evidence to recommend any particular non-pharmacological treatment for depression in traumatic brain injury.

Strengths and limitations

Some studies were not included because of the narrow focus of the review. The primary outcome of these studies was quality of life or psychological well-being and as such did not require included participants to have a diagnosis of depression or a particular cut-off score on a depression scale. While these may have been of interest, this is not necessarily a limitation as it allowed the authors to concentrate on a clinically relevant treatment effect for depression.

The authors found the quality of evidence to be low or very low in all comparisons, mainly due to the lack of blinding participants and personnel to the treatment. This lack of blinding could have affected the self-report depression symptom scales in particular. The authors suggested some suitable placebo treatments such as sham rTMS to imitate real TMS or a social contact intervention to compare to CBT.

Conclusion

The paucity of studies included makes it difficult to draw any firm conclusions. There was no strong evidence to support any of the interventions explored here. All of the studies are very recent which suggests there may be an increase in this kind of research.

The authors point to some implications for future research in this area, such as the careful consideration of what will be meaningful to the individual participants and the question of the suitability of RCT design for CBT interventions.

The review calls for future RCTs that compare active interventions with controls that replicate the effect of the attention given to participants during an active treatment.

The review calls for future RCTs that compare active interventions with controls that replicate the effect of the attention given to participants during an active treatment.

Links

Primary paper

Gertler P, Tate RL, Cameron ID. (2015) Non-pharmacological interventions for depression in adults and children with traumatic brain injury. Cochrane Database of Systematic Reviews 2015, Issue 12. Art. No.: CD009871. DOI: 10.1002/14651858.CD009871.pub2.

Other references

Ashman, T., Cantor, J. B., Tsaousides, T., Spielman, L., & Gordon, W. (2014). Comparison of cognitive behavioral therapy and supportive psychotherapy for the treatment of depression following traumatic brain injury: A randomized controlled trial. Journal of Head Trauma Rehabilitation, 29(6), 467–478. [PubMed abstract]

Ashman, T., & Tsaousides, T. (2012). Cognitive behavioral therapy for depression following traumatic brain injury: FINDINGS of a randomized controlled trial. Brain Impairment. Cambridge University Press.

Bedard, M., Felteau, M., Marshall, S., Cullen, N., Gibbons, C., Dubois, S., … Moustgaard, A. (2014). Mindfulness-based cognitive therapy reduces symptoms of depression in people with a traumatic brain injury: results from a randomized controlled trial. J Head Trauma Rehabil, 29(4), E13–22. [PubMed abstract]

Fann, J. R., Bombardier, C. H., Vannoy, S., Dyer, J., Ludman, E., Dikmen, S., … Temkin, N. (2015). Telephone and in-person cognitive behavioral therapy for major depression after traumatic brain injury: a randomized controlled trial. Journal of Neurotrauma, 32(1), 45–57. [PubMed abstract]

He, C. S., Yu, Q., Yang, D. J., & Yang, M. (2004). Interventional effects of low-frequency repetitive transcranial magnetic stimulation on patients with depression after traumatic brain injury. Chinese Journal of Clinical Rehabilitation, 8, 6044–6045.

Hoffman, J. M., Bell, K. R., Powell, J. M., Behr, J., Dunn, E. C., Dikmen, S., & Bombardier, C. H. (2010). A randomized controlled trial of exercise to improve mood after traumatic brain injury. Physical Medicine and Rehabilitation, 2(10), 911–919. [PubMed abstract]

Maas, A. I. R., Stocchetti, N., & Bullock, R. (2008). Moderate and severe traumatic brain injury in adults. Lancet Neurology, 7 (August), 728 – 741. [PubMed abstract]

Simpson, G. K., Tate, R. L., Whiting, D. L., & Cotter, R. E. (2011). Suicide prevention after traumatic brain injury: a randomized controlled trial of a program for the psychological treatment of hopelessness. The Journal of Head Trauma Rehabilitation, 26(4), 290–300. [PubMed abstract]

Photo credits

– See more at: http://www.nationalelfservice.net/mental-health/depression/treatment-for-depression-in-traumatic-brain-injury-cochrane-find-no-evidence-for-non-pharmacological-interventions/#sthash.oqwXaf7W.dpuf

Cannabis and mental illness: it’s complicated!

By Suzi Gage @soozaphone

This blog originally appeared on the Mental Elf site on 11th May 2016.

The use of recreational drugs is seen at much higher rates in populations with mental health problems than in the general population, and this is true for both legal substances such as alcohol and tobacco, as well as prohibited substances like cannabis.

But understanding what these associations mean is problematic:

  • Do the substances cause psychiatric problems?
  • Do people use recreational drugs to self-medicate?
  • Or, is there some other factor earlier in life that can lead to both risk of substance use and mental health problems?

The impact of cannabis (Hamilton, 2016) on mental health (Kennedy, 2015) is of particular interest in the USA, where cannabis is now legal in some states, and decriminalized in a number of others. There is a fear that cannabis use will increase, and therefore there is a pressing need to understand the nature of its association with psychiatric problems.

Blanco and colleagues state that this is their particular motivation for undertaking the research they have just published, to try and understand whether cannabis use predicts later substance use disorders, and also mood and anxiety disorders.

Methods

This study used a very large sample of adults in the USA, measured at 2 time-points, 3 years apart. Cannabis use in the past year was assessed at wave one, and a variety of outcomes were assessed at wave 2. These were cannabis use disorder, alcohol use disorder, nicotine dependence, other drug use disorder, mood disorder (including depressive disorder, bipolar I or II and dysthymia), and anxiety disorder (including panic disorder, social anxiety disorder, specific phobia, and generalized anxiety disorder). These were all assessed using the Alcohol Use Disorder and Associated Disabilities Interview Schedule DSM-IV.

Regression analyses were used to look at the associations between cannabis and these disorders, before and after adjustment for a variety of other factors that might influence both cannabis use and mental health, and therefore could be confounding the relationship. These were socio-demographic characteristics, family history of substance use disorder, disturbed family environment, childhood parental loss, low self-esteem, social deviance, education, recent trauma, past and present psychiatric disorder, past substance use disorder and history of divorce.

The authors also used propensity score matching to try and further account for these confounders. This is a technique where cannabis users and non-users are matched by their values for the confounding variables, then compared. If confounding is the same between cannabis users and non-users, it cannot therefore drive the associations seen, meaning they’re more likely to be causal, rather than due to other factors (although confounding has to have been known about and measured for this to be the case). The sample size is a lot smaller for these analyses, with 1,254 people in each group.

Cannabis is now legal in some US states, so evidence about it's potential risks is now even more in demand.

Cannabis is now legal in some US states, so evidence about it’s potential risks is even more in demand.

Results

Of the 34,653 participants in the study, only 1,279 (roughly 3.5%) reported having used cannabis in the past 12 months at wave one. Before taking confounders in to consideration, cannabis use at wave one was associated with substance use disorders and mood and anxiety disorders. However, this changed after accounting for the factors the authors believed might confound the relationships.

Across the regressions and the propensity matched analyses, adjustment for confounders attenuated the associations between cannabis use and later mood and anxiety disorders, suggesting that these might be due to confounding. Conversely, associations remained between cannabis use and later substance abuse and dependence. This was particularly strong for cannabis abuse, as might be expected.

  • Cannabis use at wave one was associated with around a 7x increased risk of cannabis abuse or dependence at wave 2
  • Cannabis users also had 2-3x increased risk of alcohol use disorder or any other drug use disorder
  • Cannabis users also had around 1.5x increased risk of nicotine dependence.
Cannabis use was found to increase the risk of various substance use disorders.

Cannabis use was found to increase the risk of various substance use disorders.

Conclusions

The study found evidence that cannabis use predicts substance use disorder, even after adjustment for confounding. However, they also found that associations between cannabis use and later mood and anxiety disorders seemed to be due to confounding, rather than there being a causal association.

The authors concluded:

These adverse psychiatric outcomes [substance use disorders] should be taken under careful consideration in clinical care and policy planning.

After confounders had been taken into account, cannabis use was not found to increase the risk of mood or anxiety problems.

After confounders had been taken into account, cannabis use was not found to increase the risk of mood or anxiety problems.

Strengths and limitations

A strength of this study is the use of a nationwide sample, assessed at two different time points, and that they had a really big sample size. The authors also took steps to try and keep the sample representative, even after drop-out between wave one and wave two. The consideration of confounders is also a strength, although of course causation cannot be ascertained from observational data; a limitation that the authors themselves acknowledge.

When studies are very large, as this one is, it can be hard to get really accurate measures, because of the amount of time it takes to interview 35,000 people! It is particularly impressive that the outcome measures are all according to DSM-IV criteria. However, as all these measures were taken from an Alcohol Use Disorder interview, the measures of mood and anxiety may be less good (the interview has weaker test-retest reliability for mood and anxiety disorders than for substance use disorders).

The rate of cannabis use in this study (roughly 3.5%) seems very low; the UN’s World Drug Report in 2011 (UNODC, 2011) put previous-year cannabis use in the USA at 13.7%. The data used in the Blanco study were collected in 2001, so perhaps cannabis rates have increased since then. It is notoriously hard to monitor rates of illicit drug use as people may not be keen to honestly report their use; indeed, this may be a problem in this study too, meaning people might be misclassified.

The use of other substances at wave one isn’t necessarily adequately controlled for; pre-existing substance use disorders are controlled for, but less extreme use of a substance isn’t. So these participants that are using cannabis might also be smoking cigarettes, drinking alcohol, or using other illicit drugs. There’s no way to know from this study which came first, and this makes it difficult to know whether cannabis is causing the associations seen, or whether it could be another substance, for example.

While the use of propensity score matching is perhaps a stronger method to assess causation than simply adjusting for confounders, the technique cannot take in to account confounders that vary over time, as these could vary differently between cannabis users and non-users, and still be confounding the association despite being the same at one time point.

Although the authors rightly highlight that associations of cannabis use with later substance use disorders are robust to confounding, their conclusions don’t highlight that adjustment actually reduced the association between cannabis use and later mood and anxiety disorders to the null. I think this is a really interesting finding, and maybe should have been made more of.

Why did the authors not make more of their finding that cannabis use does not increase the risk of depression or anxiety?

Why did the authors not make more of their finding that cannabis use does not increase the risk of depression or anxiety?

Summary

This is a well designed study on a really large sample, and provides useful information about associations between cannabis use and later substance use disorders, as well as suggesting that perhaps associations between cannabis use and mood and anxiety disorders might be due to other factors, rather than due to cannabis causing these outcomes. It still doesn’t really tell us why cannabis use might increase the risk of substance use disorders, and doesn’t tell us that cannabis is causing this increase of risk.

Links

Primary paper

Blanco C, Hasin DS, Wall MM, et al. (2016) Cannabis Use and Risk of Psychiatric Disorders: Prospective Evidence From a US National Longitudinal Study. JAMA Psychiatry.Published online February 17, 2016. doi:10.1001/jamapsychiatry.2015.3229. [PubMed abstract]

Other references

Hamilton I. (2016) Cannabis: what do we know and what do we need to know? The Mental Elf, 17 Mar 2016.

Kennedy E. (2015) High potency cannabis and the risk of psychosis. The Mental Elf, 24 Mar 2015.

UNODC (United Nations Office on Drugs and Crime) (2011) UN World Drug report 2011. United Nations.

Photo credits

– See more at: http://www.nationalelfservice.net/mental-health/substance-misuse/cannabis-and-mental-illness-its-complicated/#sthash.U9604663.dpuf