by Olivia Maynard @OliviaMaynard17
Now that the festive season is almost upon us, I’ve been wading through the list of jobs I’ve been putting off for longer than I can remember, with the hope of starting afresh in 2016.
One of these jobs is wrapping up some of the studies I’ve been running this year, tidying up the data files and deciding what to do with the results. Obviously it’s best practice to write up all studies for publication in peer-reviewed journals, but sometimes this isn’t possible straight away (for example, when we’ve collected pilot data which will inform larger studies or research grants), although journals specifically for pilot and feasibility work do exist. However, it’s still important to share the findings, at the very least to prevent other research groups from running exactly the same pilot study (avoiding the file drawer effect).
The pilot study I’m trying to wrap up was conducted in September this year and is worth reporting, not only because the research is interesting, but also because the method of data collection was novel.
In December 2014 we were approached by the Behavioural Insights Team (BIT), who asked whether we’d be interested in running an experiment at their annual conference. Alongside a star-studded list of speakers, the BIT had planned to demonstrate to conference delegates the power of behavioural insights, by running a series of mini-experiments throughout the conference. We were asked to contribute, not only because I had previously worked in the BIT as part of a placement during my PhD, but also because of TARG’s track record in running behavioural experiments to influence alcohol consumption, both in the lab and in the ‘real-world’.
 The team asked us to run an experiment in the Skylon bar in the Royal Festival Hall – the venue of the conference drinks reception. After an initial assessment of the bar (yes, this is a tough job!) and discussing various possible experiments we could conduct, we finally decided to examine the impact of glass size on alcohol consumption. While considerable previous research has shown that plate size is an important driver in food consumption, and we have shown that glass shape (i.e., curved versus straight) influences alcohol consumption, there is very little research on the impact of glass size on alcohol consumption. Larger wine glasses are increasingly common and these may increase wine consumption and drinking speed by suggesting larger consumption norms to consumers, or by tricking consumers into thinking there’s a smaller amount in the glass than in a smaller glass which is equally full.
The primary aim of this pilot study was to determine the feasibility of implementing a glass size intervention study in a real-world drinking environment in order to inform future studies in this area.
Method
Prior to starting the study, as with every TARG study, we published the protocol online on the Open Science Framework. Depending on the side of the bar they were stood in, delegates attending the drinks reception were provided with either a small or a large wine glass, each of which was filled to the same volume. Every 15 minutes we counted the number of delegates on the two sides of the bar and every hour (for three hours) we counted the number of empty wine bottles on each side of the bar. We calculated the average volume of wine consumed per delegate each hour and then compared these between the two groups.
Results
From a feasibility point of view, the study worked as well as expected. Follow-up interviews with the manager of the bar indicated that bar staff enjoyed the process of participating in a study and were happy to participate again in future studies.
However, because we were conducting this in the real-world, rather than in our carefully controlled laboratory environment, we encountered a few logistical challenges. Here are the key points we learned from running this pilot study:
- In the real-world, there’s a necessary trade-off between collecting the data and not disrupting normal behaviour

Ideally we would have counted the number of empty bottles more frequently than every hour in order to get a more accurate measure of how much was consumed by the delegates. However prior to the start of the study, the bar manager suggested that this would interfere with their service and the bar staff reiterated this after the study had finished. As the bar staff were vital to the success of this pilot study, we didn’t think it was appropriate to push for more data collection than they felt comfortable with.
- Complete control of the environment isn’t possible in the real-world

To prevent delegates from moving between the two sides of the bar we placed physical barriers between them, such as sofas, plants and lamps. However, inevitably, some delegates who wanted to ‘work the room’ at what was essentially a networking event did make their way past the barriers we set up. Other than instructing the waiters to replace the glass of those who had moved sides with the glass size appropriate for the side of the bar they were now in, there was very little we could do about this, short of frog-marching delegates back to their original side (which we thought wouldn’t go down very well on this occasion!)
- Accurate enforcement of study conditions is more difficult in the real-world

If we had conducted this study in the laboratory, we would have randomised participants to receive one of two glass sizes and carefully poured the exact volume of wine into their glass. In this real-world study, however, we had to rely on the waiters to accurately pour the wine into the glasses. Although highly trained, the waiters may also have fallen foul of the visual illusion the different glasses present (an effect which has been shown in previous real-world experiments). Future studies could monitor waiter pouring behaviour before and during the study.
- Studies in real bars have some other unexpected challenges…

The BIT had asked that we present the results at 9am the following morning, allowing a nine hour turnaround from the end of the study to data presentation. This time pressure was not helped by the large quantities of complimentary champagne being served at the event, which considerably slowed down data entry and analysis at midnight!
Despite this substantial challenge, the results of the study were presented the following morning.
These data suggested that there was no difference in volume of wine consumed between the groups drinking from larger glasses and those drinking from 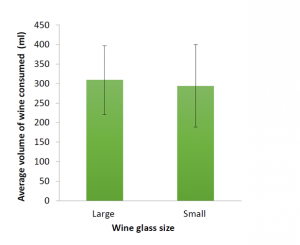 smaller glasses. As this study wasn’t powered to detect a meaningful difference between the two groups, we weren’t really surprised by this finding. However, these pilot data, along with the lessons learned from conducting the study will be used to inform our future research studies and grant applications.
And there we have it – another pilot study out of the file drawer and another item crossed off my ‘to-do’ list.
I’d like to thank the entire Behavioural Insights Team, in particular Ariella Kristal and Gabrielle Stubbs, for making this study happen, Carlotta Albanese from the Skylon bar and David Troy and Jim Lumsden from TARG for helping with all the data collection (and data entry at midnight).